Easily visualize your processes and workflows with smart automation.
Create visual organizational structures with images and detailed profiles.
Visualize concepts and their relationships on an infinite visual canvas.
Map family history and understand the relationships with detailed genograms.
Visualize relationships between entities using Crows Foot or Chen notation.
Visualize your network infrastructure. Support AWS, CISCO, Azure and more.
Visualize and expand your ideas using our powerful mind mapping tool.
Easily create family trees with our professionally designed templates.
Infinite canvas to add diagrams, images, sticky notes and more.
Run collaborative meetings, workshops or brainstorming sessions.
Collaborative diagramming for educators and students at discounted rates.
Log In
Sign Up Free
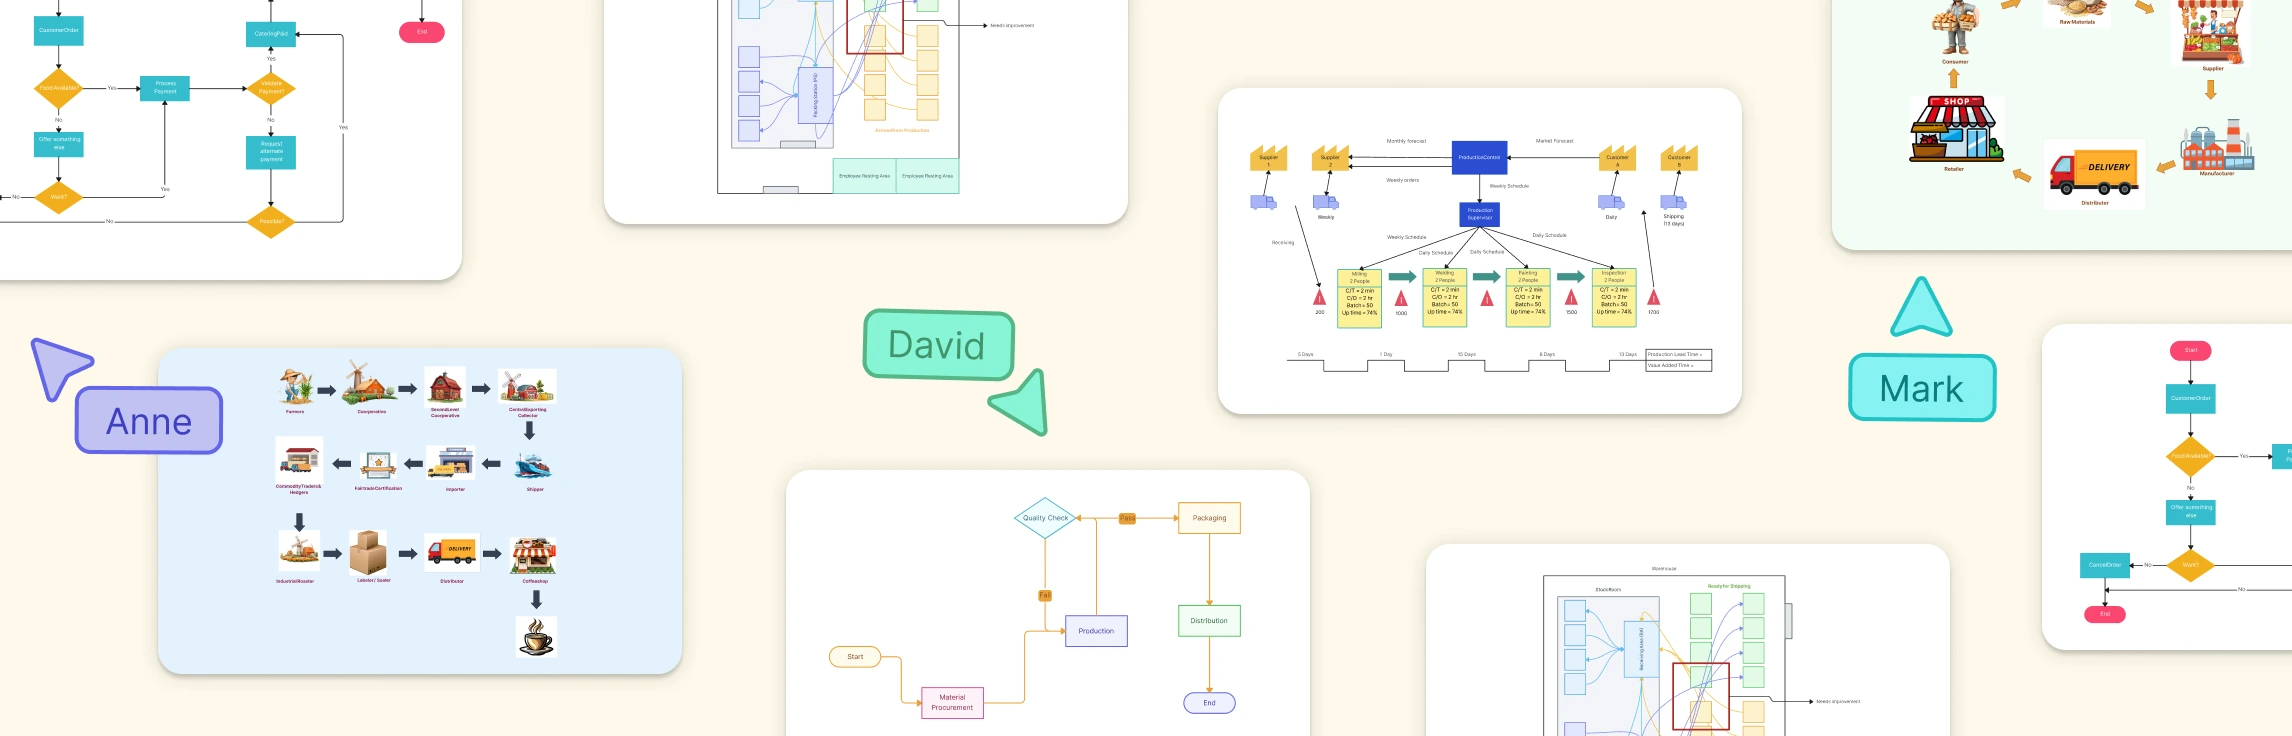
Supply chain diagram examples show how materials, information, money and responsibilities flow from suppliers to end customers; they turn complex networks into a visual model teams can reason about. According to authoritative supply‑chain guidance, diagrams capture product, information, and capital movement across organizations.
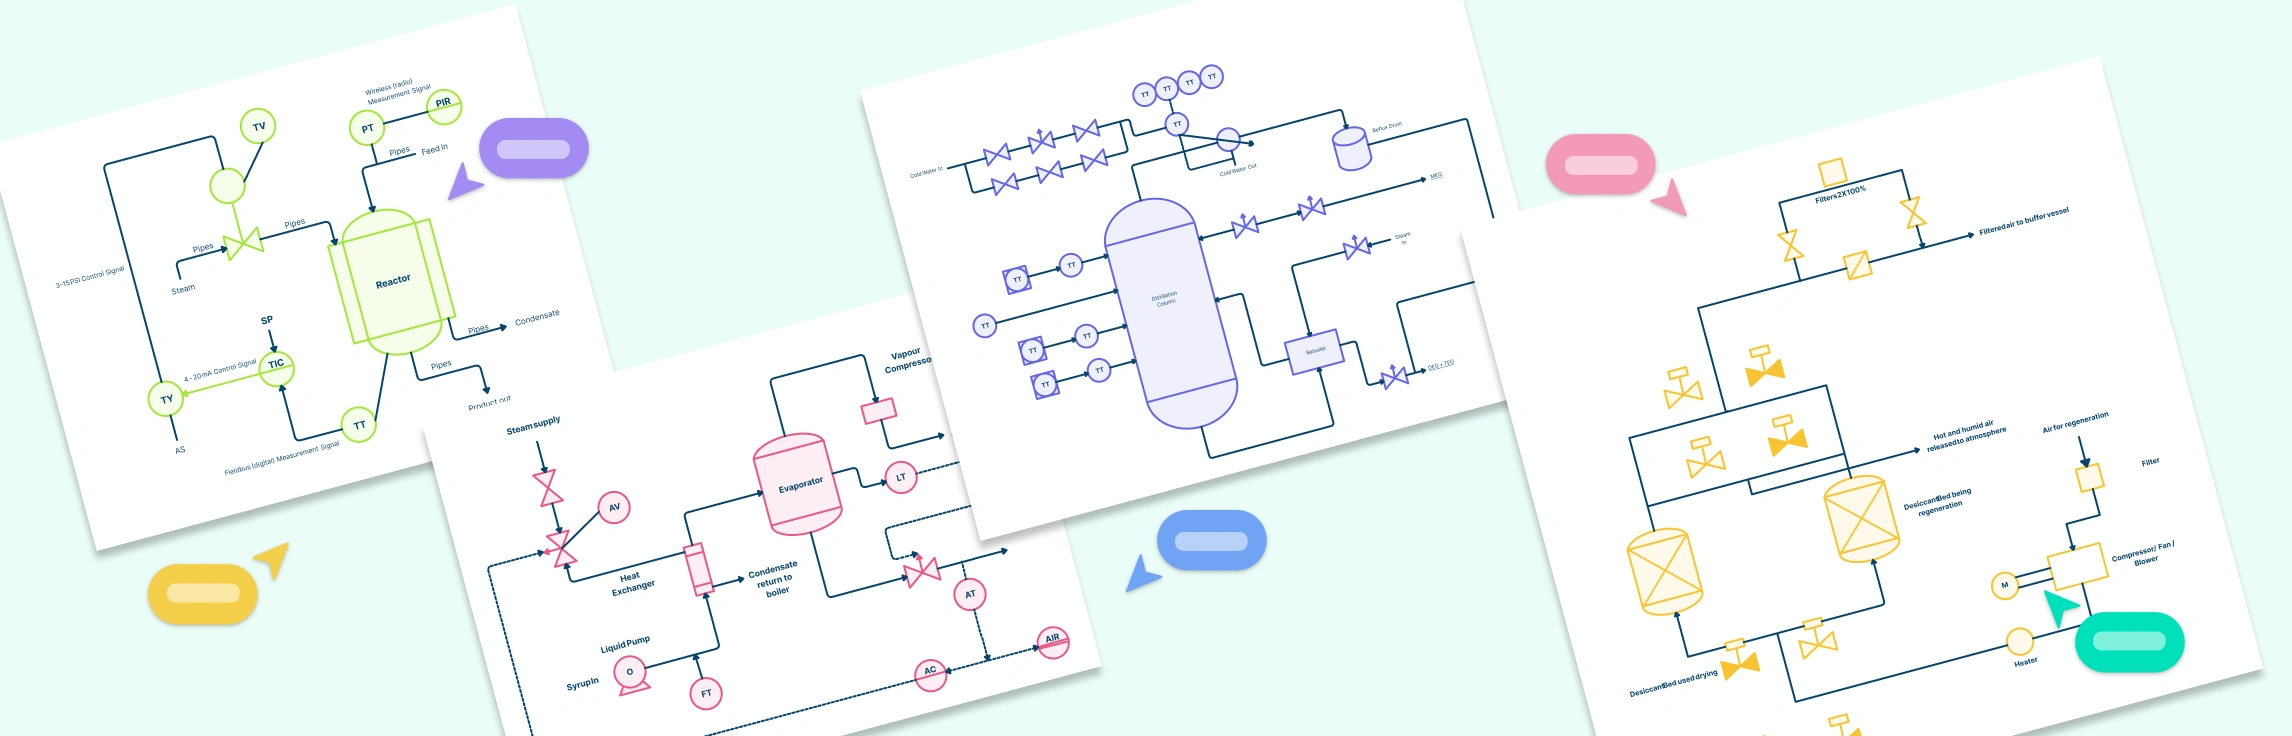
Piping and Instrumentation Diagrams (P&IDs) are essential tools in process engineering, helping professionals visualize systems, monitor controls, and optimize workflows. Whether you’re designing a chemical reactor, managing a heat exchanger, or planning large-scale production processes, having clear and accurate P&ID examples can save time and reduce errors.
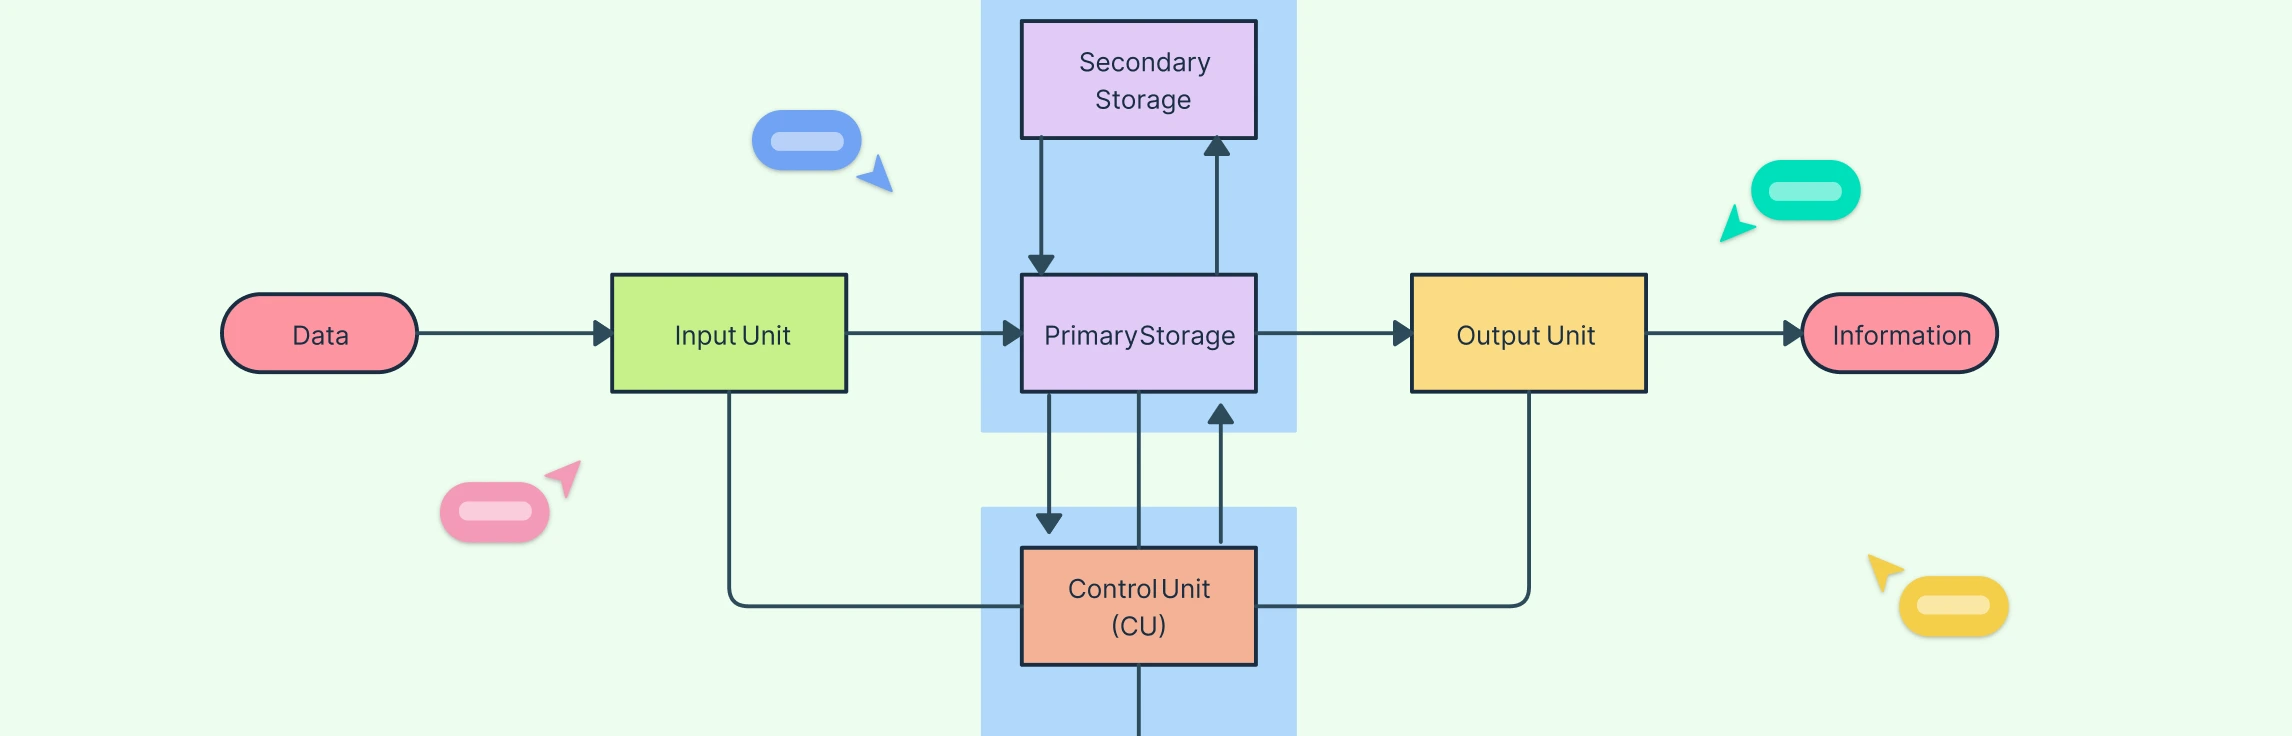
In this guide, we’ll explain what a block flow diagram is, its purpose in process design, the key components that make it effective, and how to create one. You’ll also learn how it compares to more detailed diagrams like process flow diagrams, along with its benefits, limitations, and practical uses in engineering workflows.
Understanding what is a Piping and Instrumentation Diagram (P&IDs), is essential for anyone involved in process design, engineering, or plant operations. These diagrams serve as the foundation for building, analyzing, and maintaining complex systems safely and efficiently. In this guide, we’ll explore what is P and ID, their purpose, key components and real-world engineering applications.
Understanding Piping and Instrumentation Diagram (P&ID) symbols is essential for anyone involved in process design, engineering, or plant operations. These standardized symbols form the visual language of process systems, allowing engineers to design, communicate, and maintain complex industrial setups accurately. In this guide, we’ll break down the different types of P and ID symbols, the international standards that define them, and the best practices to follow when creating or reading P&ID diagrams.
In this guide, we’ll explain why it’s important to understand piping and instrumentation diagrams, break down how to interpret lines, labels, and tags, and walk you through a step-by-step method for how to read piping and instrumentation diagrams. This also covers common notations, abbreviations, and best practices to help you confidently analyze and work with these critical technical documents.
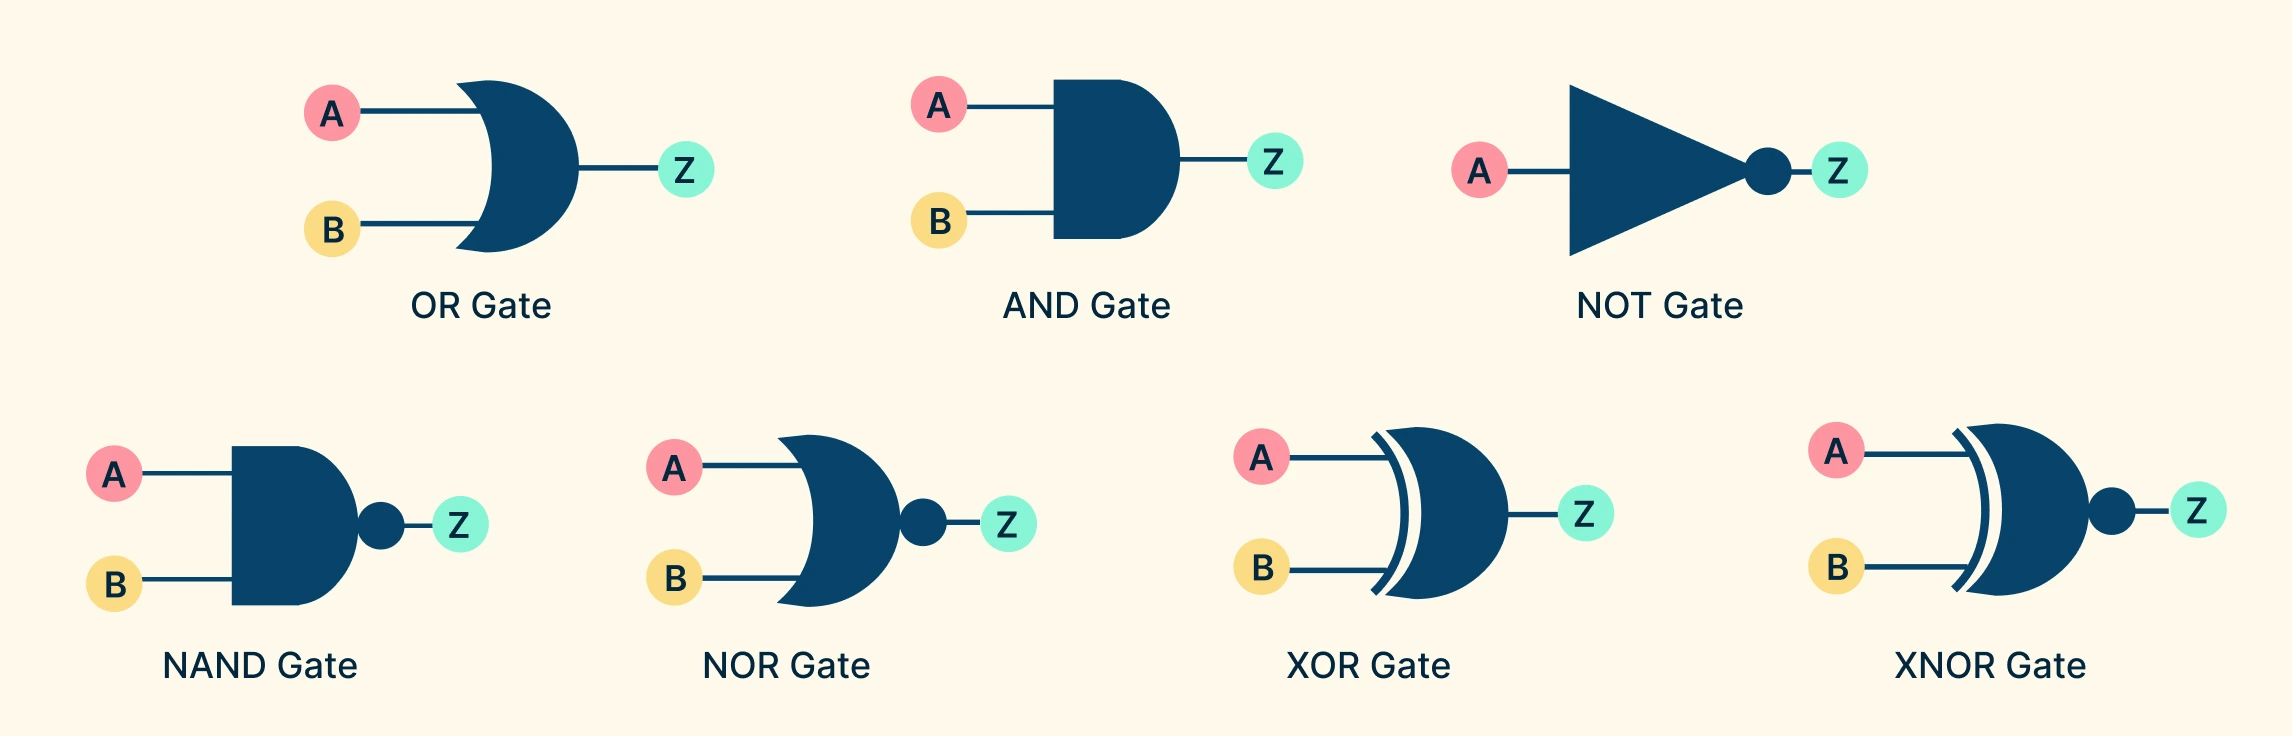
Definition of a Logic Gate Diagram A logic gate diagram is a visual representation of how different logic gates are connected in a digital circuit. Instead of describing logical operations with words or equations, the diagram uses standardized symbols and lines to show how signals flow between them. In short, a logic gate diagram acts as a blueprint for digital decision-making, showing how simple logic gates come together to form complex systems like adders, comparators, memory units, and processors.
Logic gates are tiny electronic devices that take one or more input signals and produce a single output based on logical rules such as AND, OR, and NOT. By combining these gates in different ways, engineers can design everything from simple calculators to complex processors that power modern computers. In this guide, we’ll explore the different logic gate types, the symbols that represent them in logic gate diagrams, and the ways they can be combined to form more complex integrated circuits.
Have you ever felt lost in a complicated process at work or struggled to explain how something gets done? That’s where a workflow diagram comes in. It’s a simple, visual way to show the steps of a process from start to finish. By mapping out tasks, decisions, and who is responsible for what, workflow diagrams help teams work more efficiently and avoid confusion.
A system flowchart is a simple but powerful way to visualize how a process works. It breaks down complex systems into easy-to-follow steps using standard symbols and logical connections. Whether you’re designing a business workflow, developing software, or improving efficiency in an organization, a system flowchart helps you see the bigger picture.
Specification and Description Language (SDL) diagrams are a powerful way to visually model complex systems, especially those that are event-driven or operate in real time. They help designers, engineers, and developers clearly define system components, communication flows, and behaviors. Whether you’re working on software development, telecommunications, or embedded systems, SDL diagrams make it easier to understand how different parts of a system interact. This guide will walk you through everything you need to know about SDL diagrams—from their purpose and symbols to how to create and use them effectively.
An Event-Driven Process Chain (EPC) diagram is a valuable tool for visualizing and modeling business processes. It helps organizations understand how events and functions are connected, improving workflow and identifying areas for improvement.
In today’s competitive landscape, achieving seamless supply chain operations hinges on effective supply chain mapping. This strategic practice involves visualizing and tracking the movement of goods, information, and finances across the entire supply network. Supply chain mapping not only provides a visual overview but also plays a pivotal role in understanding key operational elements, enabling businesses to identify risks and manage them proactively. This guide will walk you through the process of supply chain mapping.
In today’s rapidly evolving business landscape, the ability to effectively manage and optimize supply chains has become more critical than ever. Supply Chain Visualization offers organizations a powerful means of transforming complex data into clear, actionable insights. By creating visual representations of supply chain processes, businesses can enhance their understanding of how products flow from suppliers to customers, identify potential bottlenecks, and make informed decisions that drive efficiency. This guide explores the fundamentals of supply chain visualization, delving into its significance and various applications, and providing a roadmap for organizations seeking to improve their operational effectiveness and responsiveness in an increasingly competitive market.
In today’s fast-paced business environment, effective logistics optimization is essential for organizations striving to enhance their operational efficiency and maintain a competitive edge. This guide aims to explore the concept of logistics optimization and provide practical insights for implementing it in your business. We will begin by exploring what logistics optimization entails delving into the numerous benefits that effective logistics optimization can offer. Next, we will outline the critical stages of logistics optimization, providing a structured approach to streamline your processes. Finally, we will introduce seven essential diagrams designed to facilitate effective logistics optimization, enabling you to visualize and implement strategies that unlock efficiency within your supply chain. Whether you are a logistics professional or a business leader, this guide will equip you with the knowledge and tools necessary to enhance your logistics operations and drive success.
What are Distribution Channels Distribution channels are crucial networks that transport products from producers to consumers, significantly impacting a business’s go-to-market strategy. They ensure efficient product delivery, support market expansion, and enhance access to diverse customer segments. By optimizing logistics and aligning distribution strategies with business goals, companies can reduce costs, improve customer satisfaction, and increase sales.
If you run a business that sells physical products, you know how important it is to keep track of your inventory. Inventory management is the process of planning, organizing, and controlling your stock levels to meet customer demand and avoid overstocking or running out of products. Inventory management techniques are the methods and tools you use to optimize your inventory management process.
The success of a business operation relies heavily on the clarity of its processes. This is where SIPOC comes in, offering a structured framework for understanding, analyzing, and improving business workflows. SIPOC is used extensively in business process analysis to gain a holistic view of operations.
Whether you’re a small business owner or part of a larger enterprise, having a streamlined system to track and manage your stock is paramount. That’s where inventory templates come into play. In this post, we’ll delve into the key features of inventory templates and guide you on how to use it effectively.
Business process management (BPM) is an effective strategy for improving efficiency, streamlining operations, and achieving strategic goals. In this easy guide, we’ll explore what is business process management, its various types, essential process steps, templates, the wide-ranging benefits it delivers and more. Better understand, implement, and leverage the power of BPM to optimize your business operations. Let’s get started!
Frustrated with slow workflows, rising costs, or processes that just don’t seem to work? Business Process Reengineering (BPR) offers a powerful way to rethink and redesign your operations for greater efficiency, speed, and results. In this guide, we’ll explore what BPR is, the key steps to implement it, and practical templates you can use to transform your processes and give your organization a competitive edge.