Easily visualize your processes and workflows with smart automation.
Create visual organizational structures with images and detailed profiles.
Visualize concepts and their relationships on an infinite visual canvas.
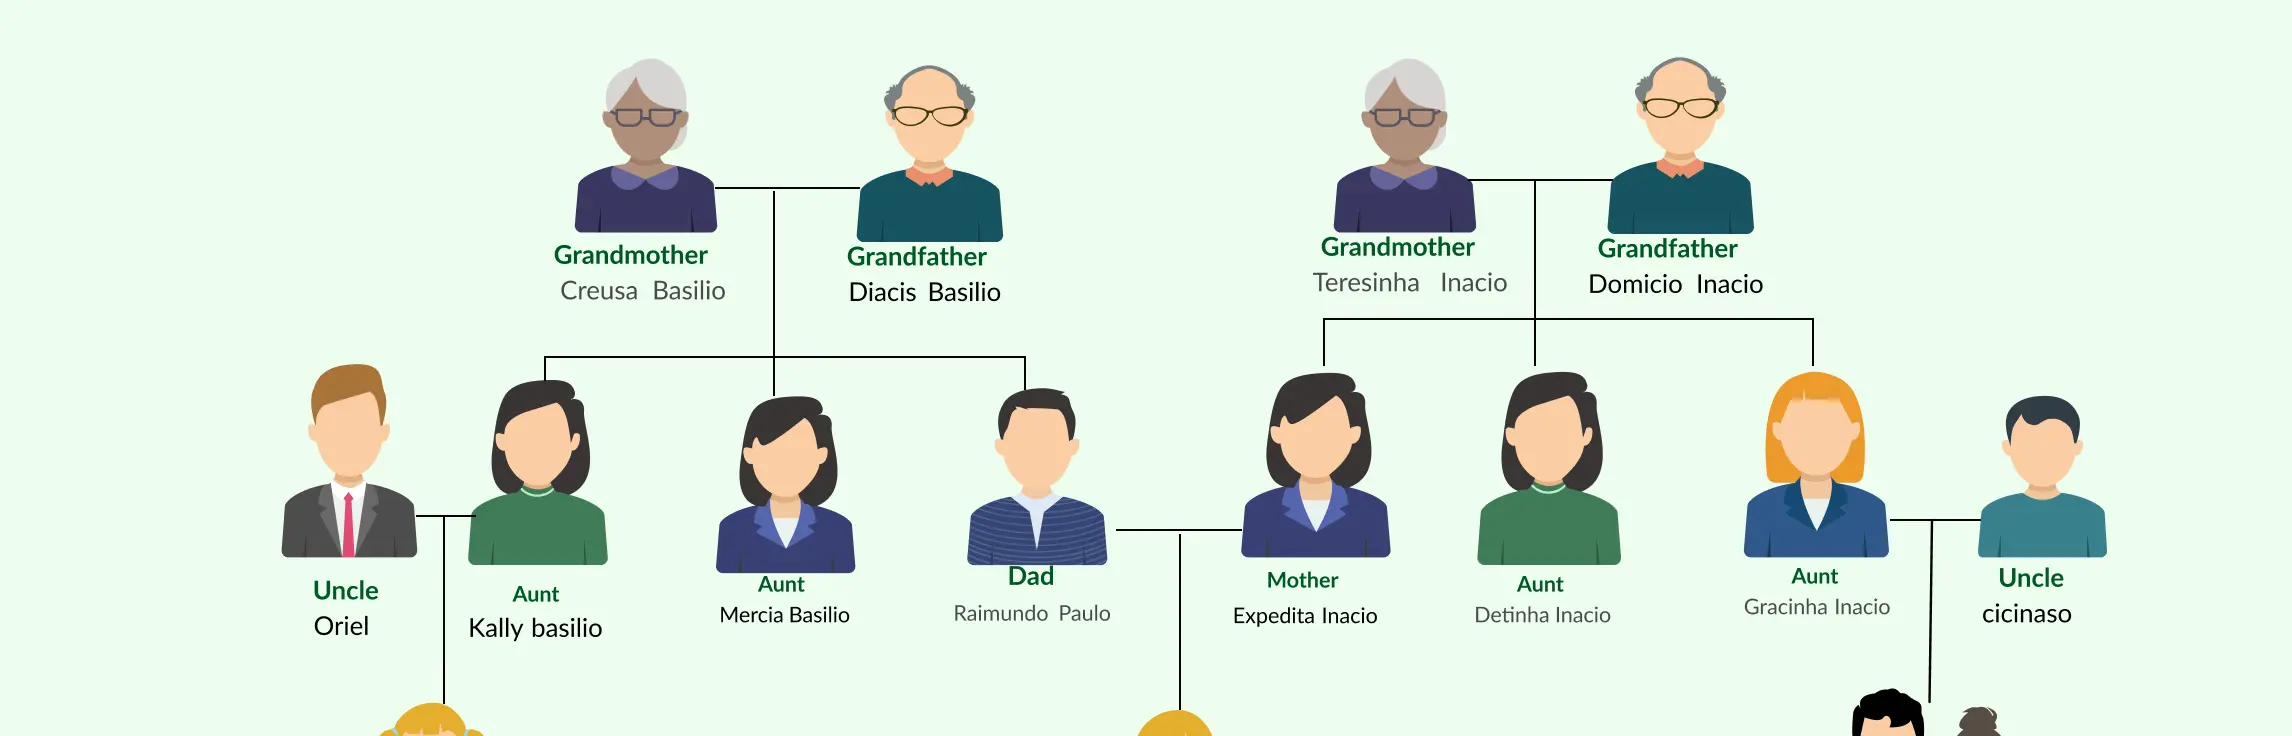
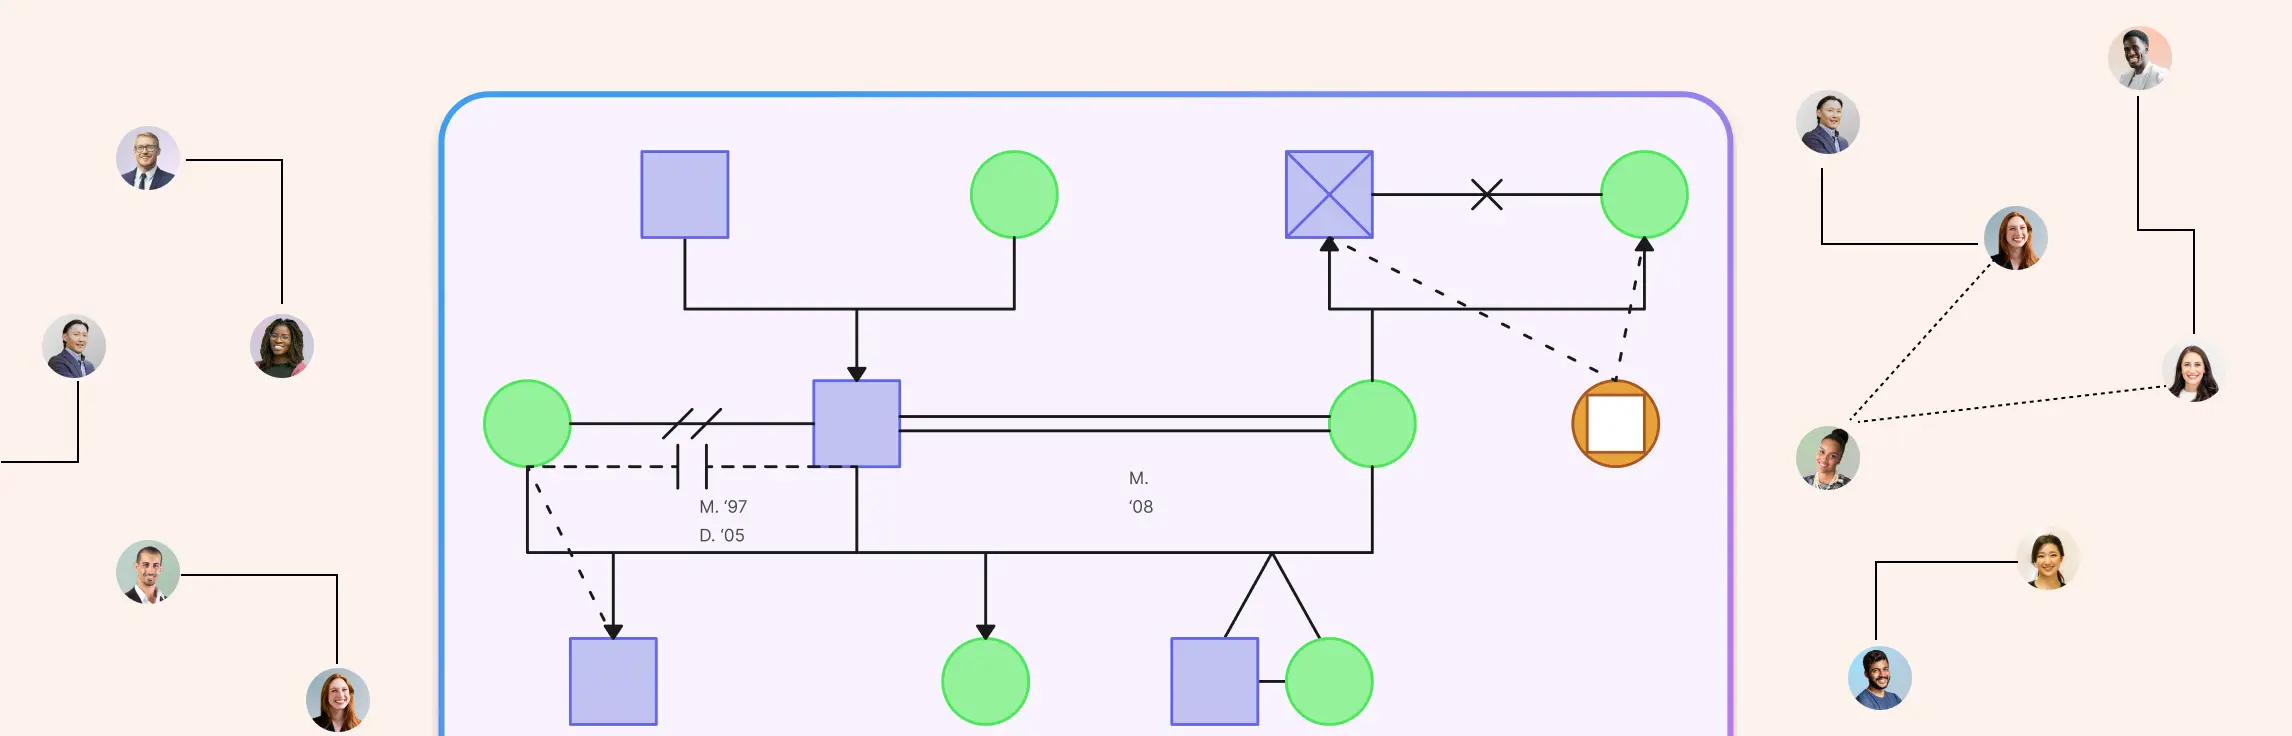
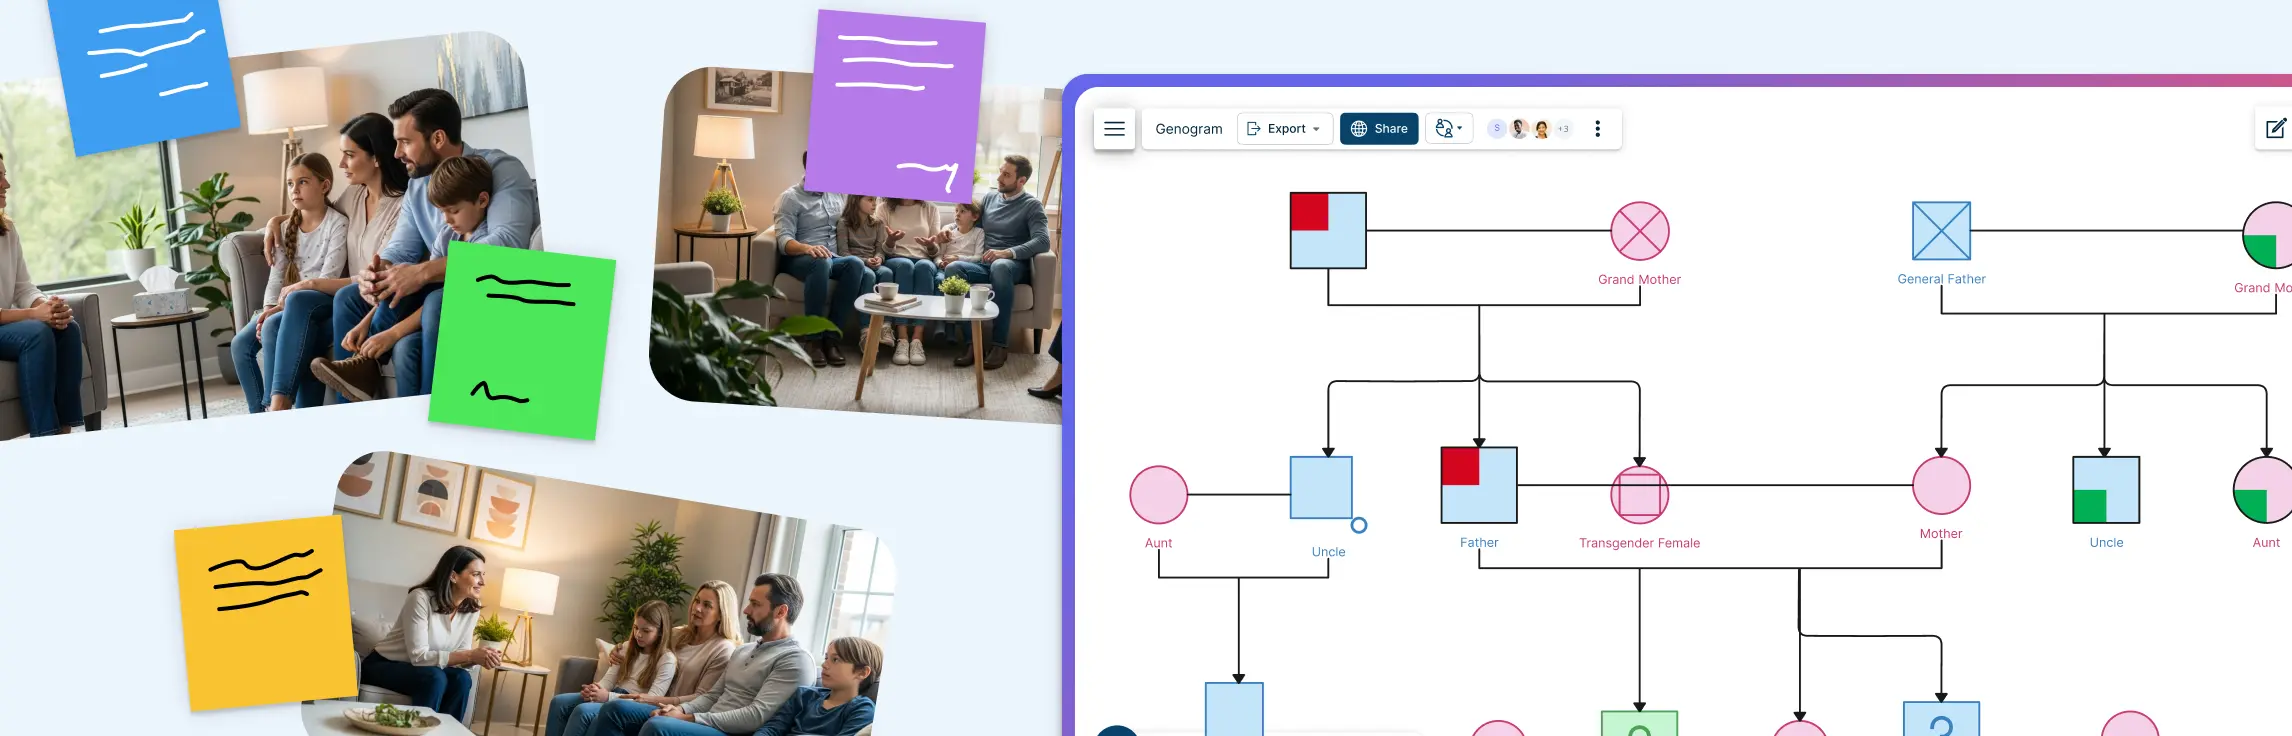
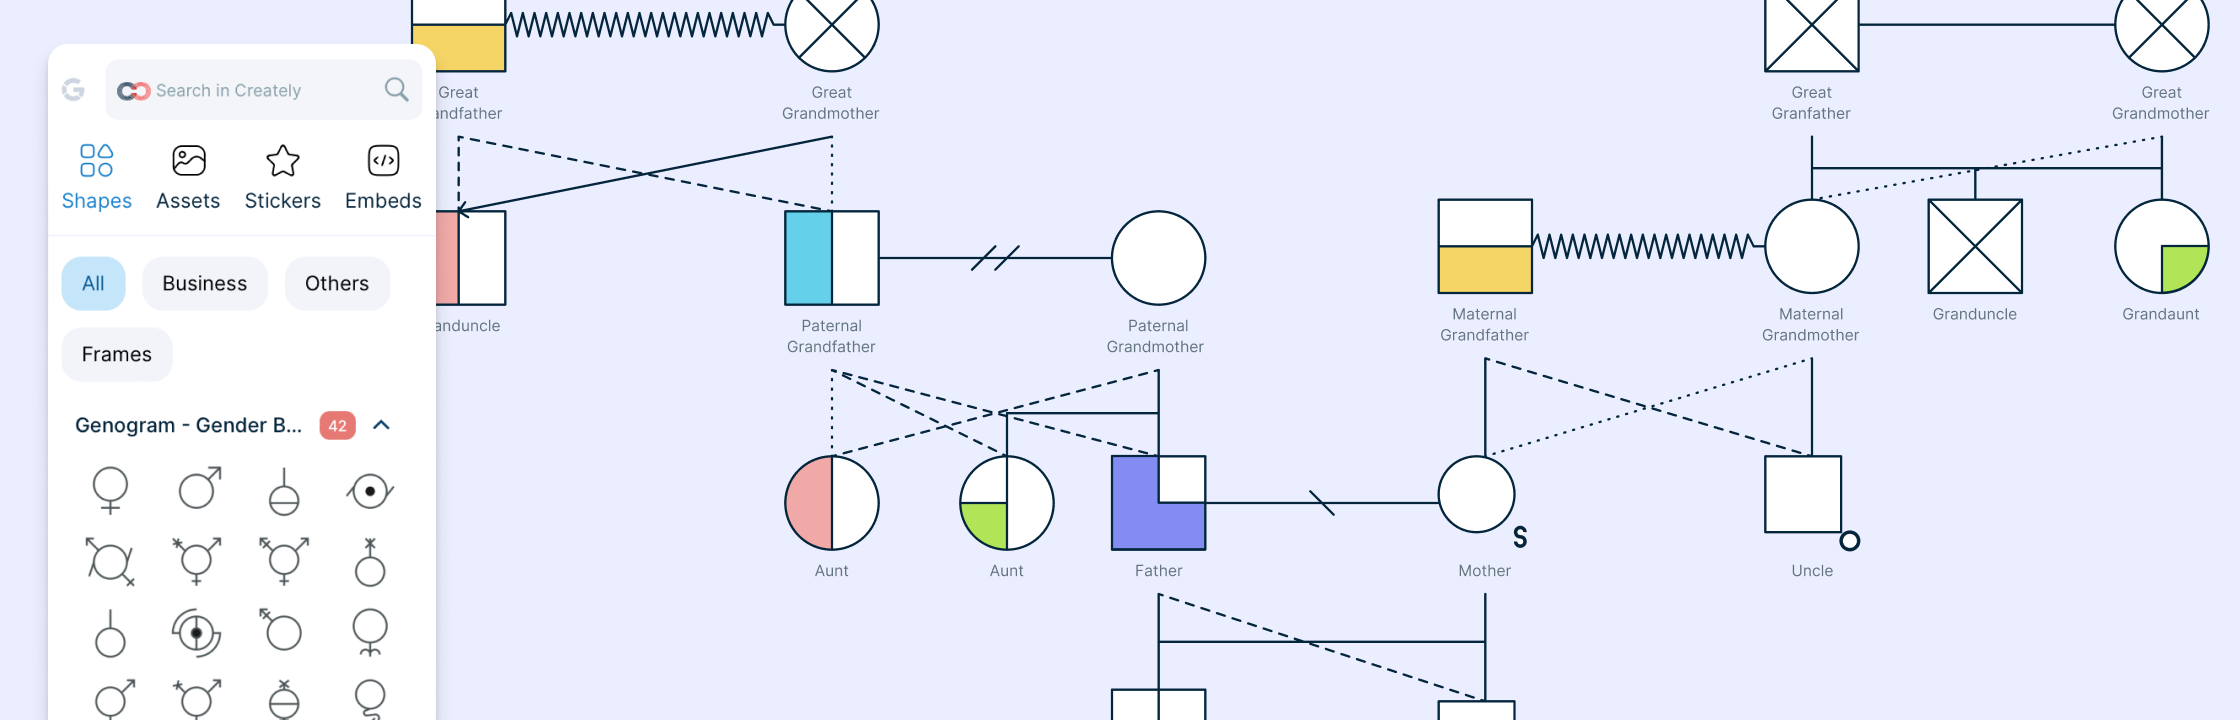
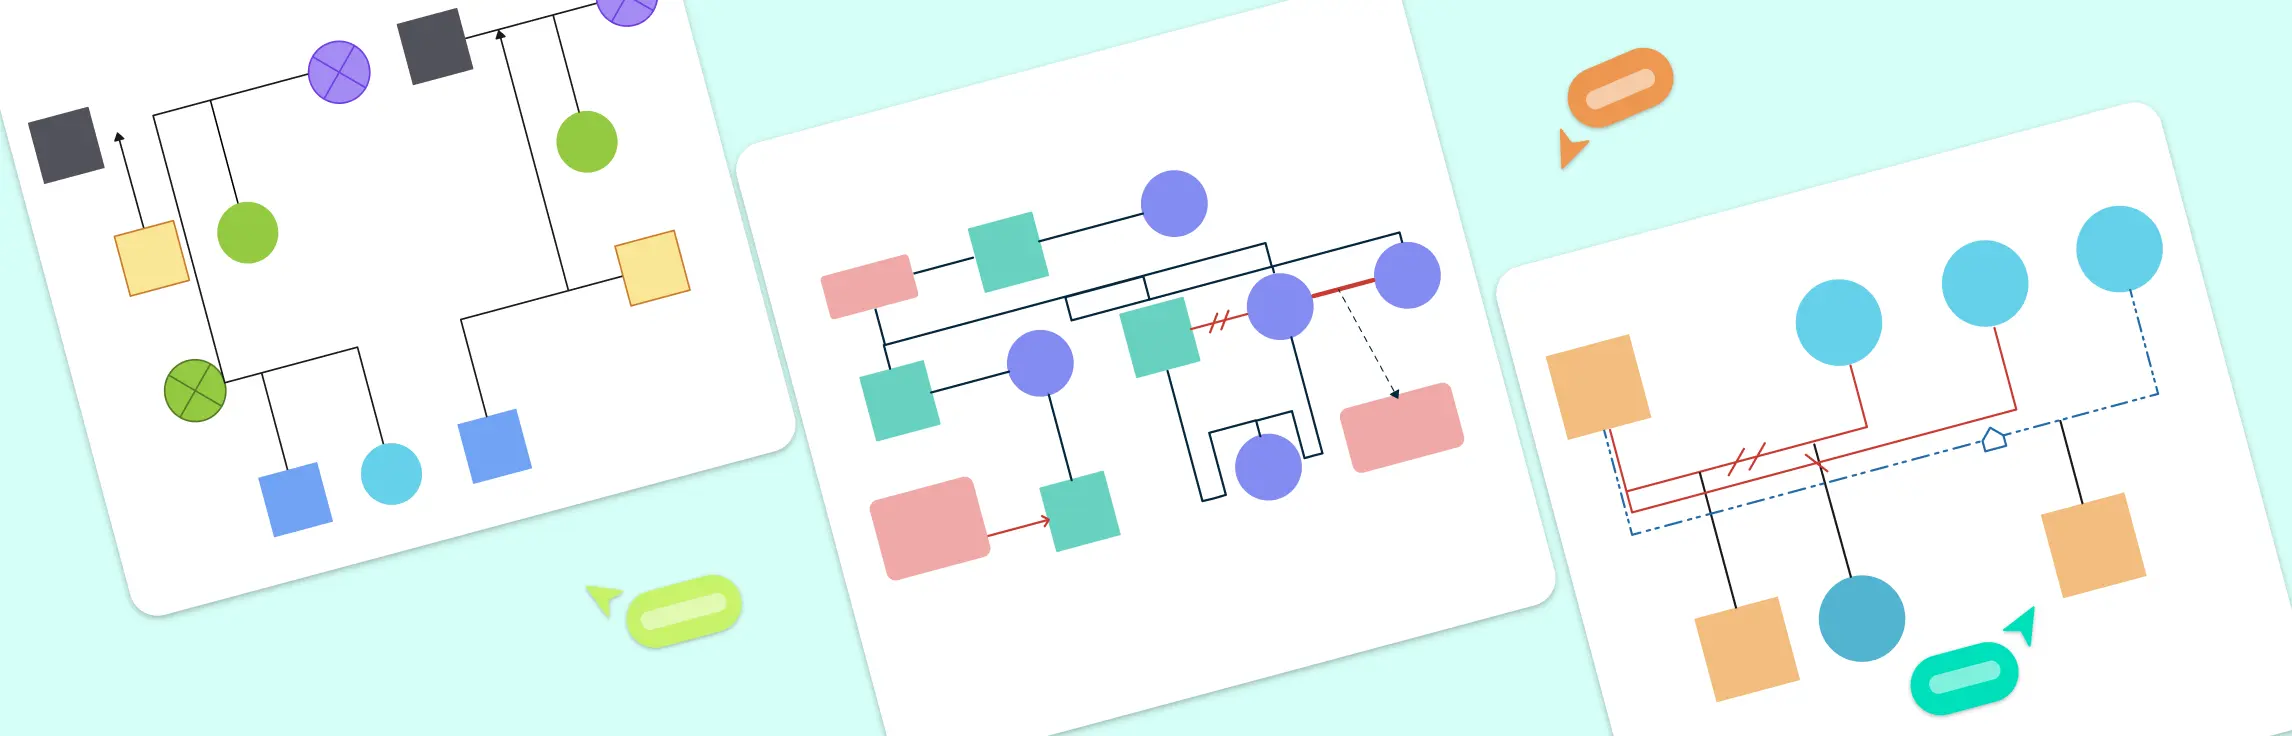
Map family history and understand the relationships with detailed genograms.
Visualize relationships between entities using Crows Foot or Chen notation.
Visualize your network infrastructure. Support AWS, CISCO, Azure and more.
Visualize and expand your ideas using our powerful mind mapping tool.
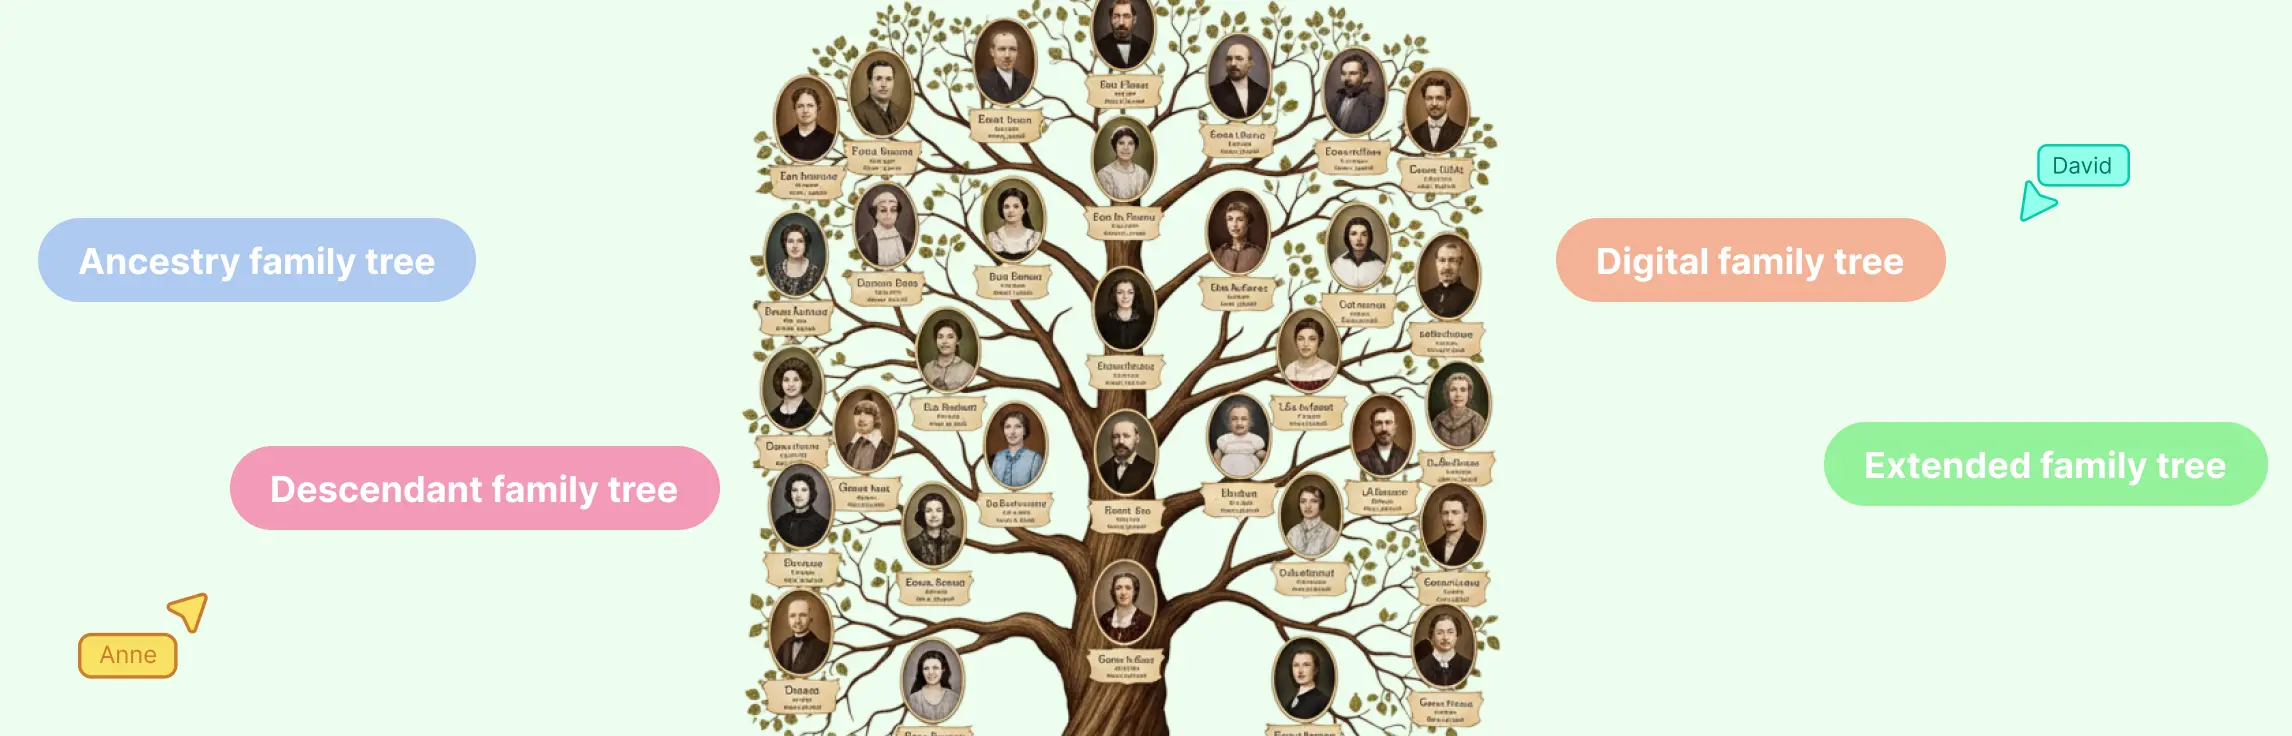
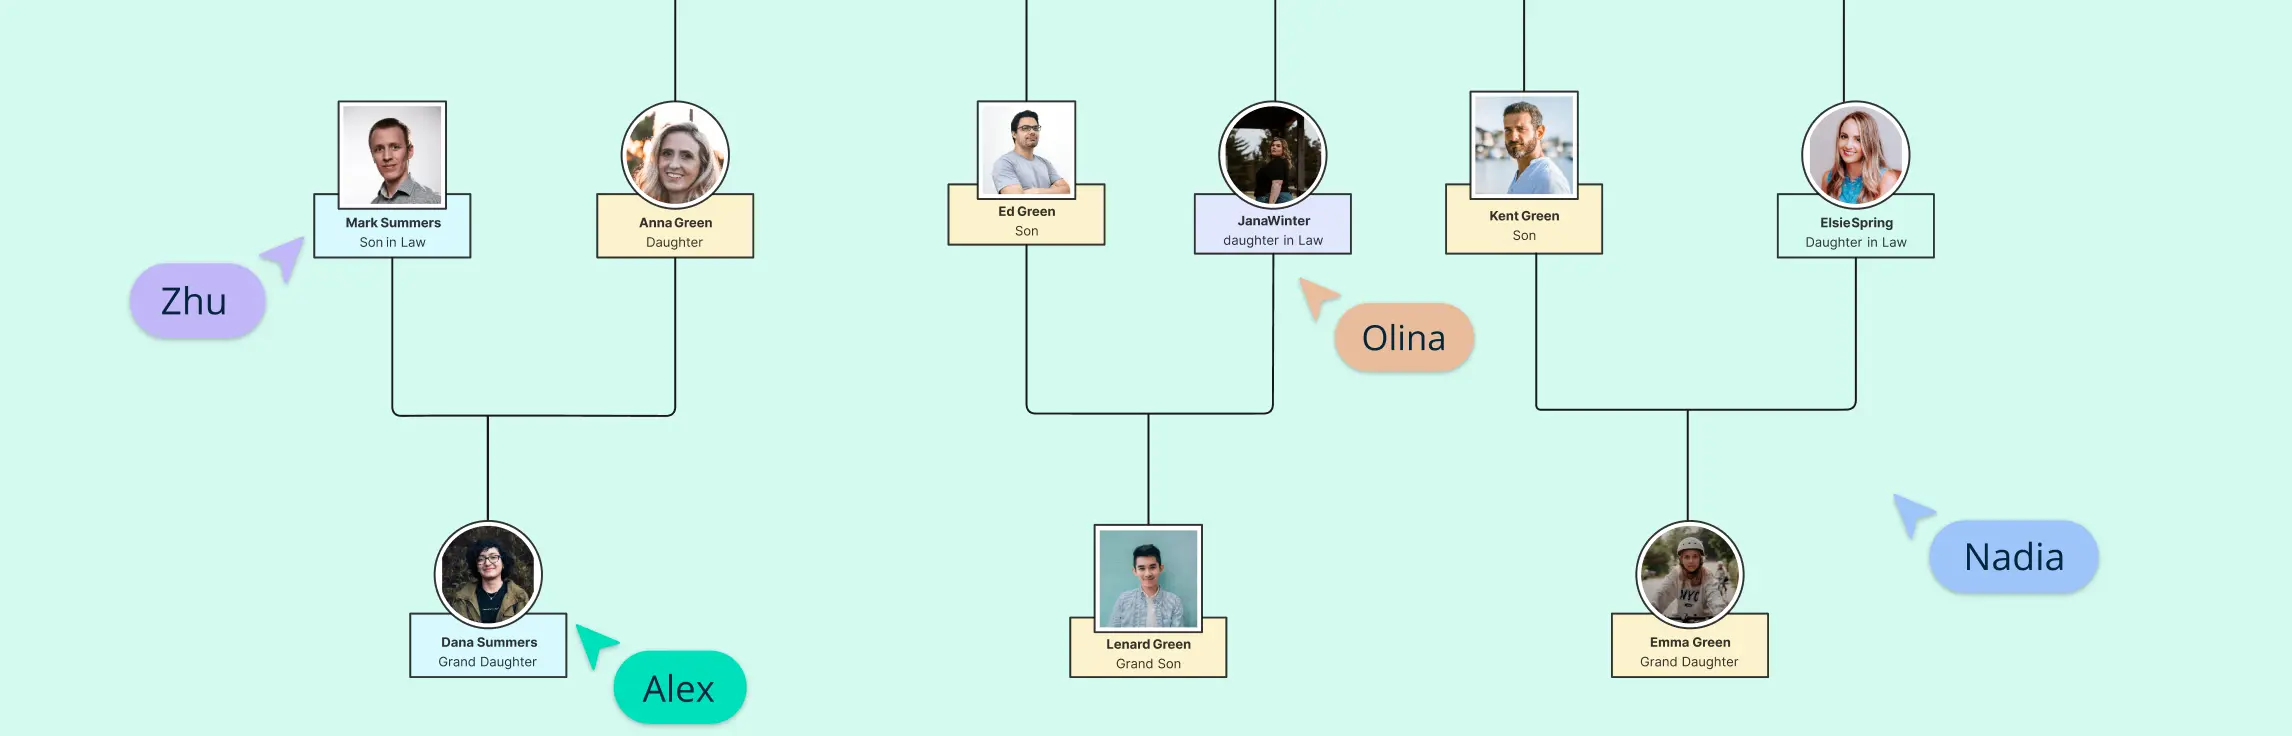
Easily create family trees with our professionally designed templates.
Infinite canvas to add diagrams, images, sticky notes and more.
Run collaborative meetings, workshops or brainstorming sessions.
Collaborative diagramming for educators and students at discounted rates.
Log In
Sign Up Free
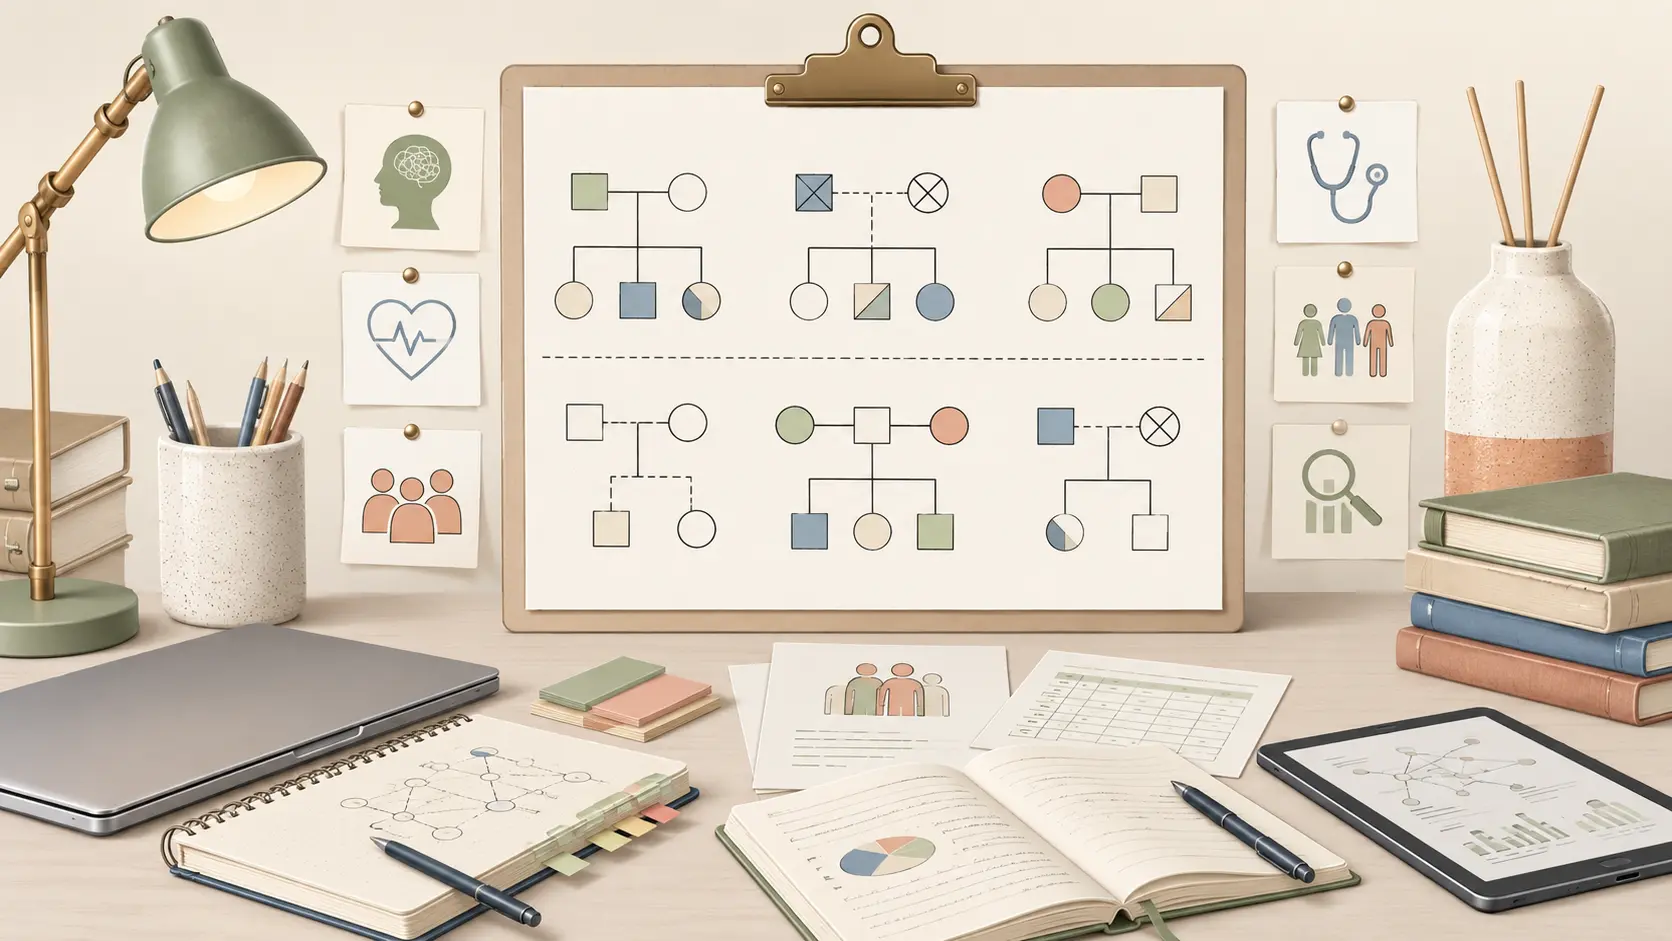
Graduate genogram assignments vary by course and program. One class may ask you to map your family of origin, while another focuses on a clinical case, cultural influences, or family health history. The examples below cover some of the most common graduate-level assignments and show what information to include in each one. Choose the template that best matches your assignment, then customize it instead of starting from scratch.
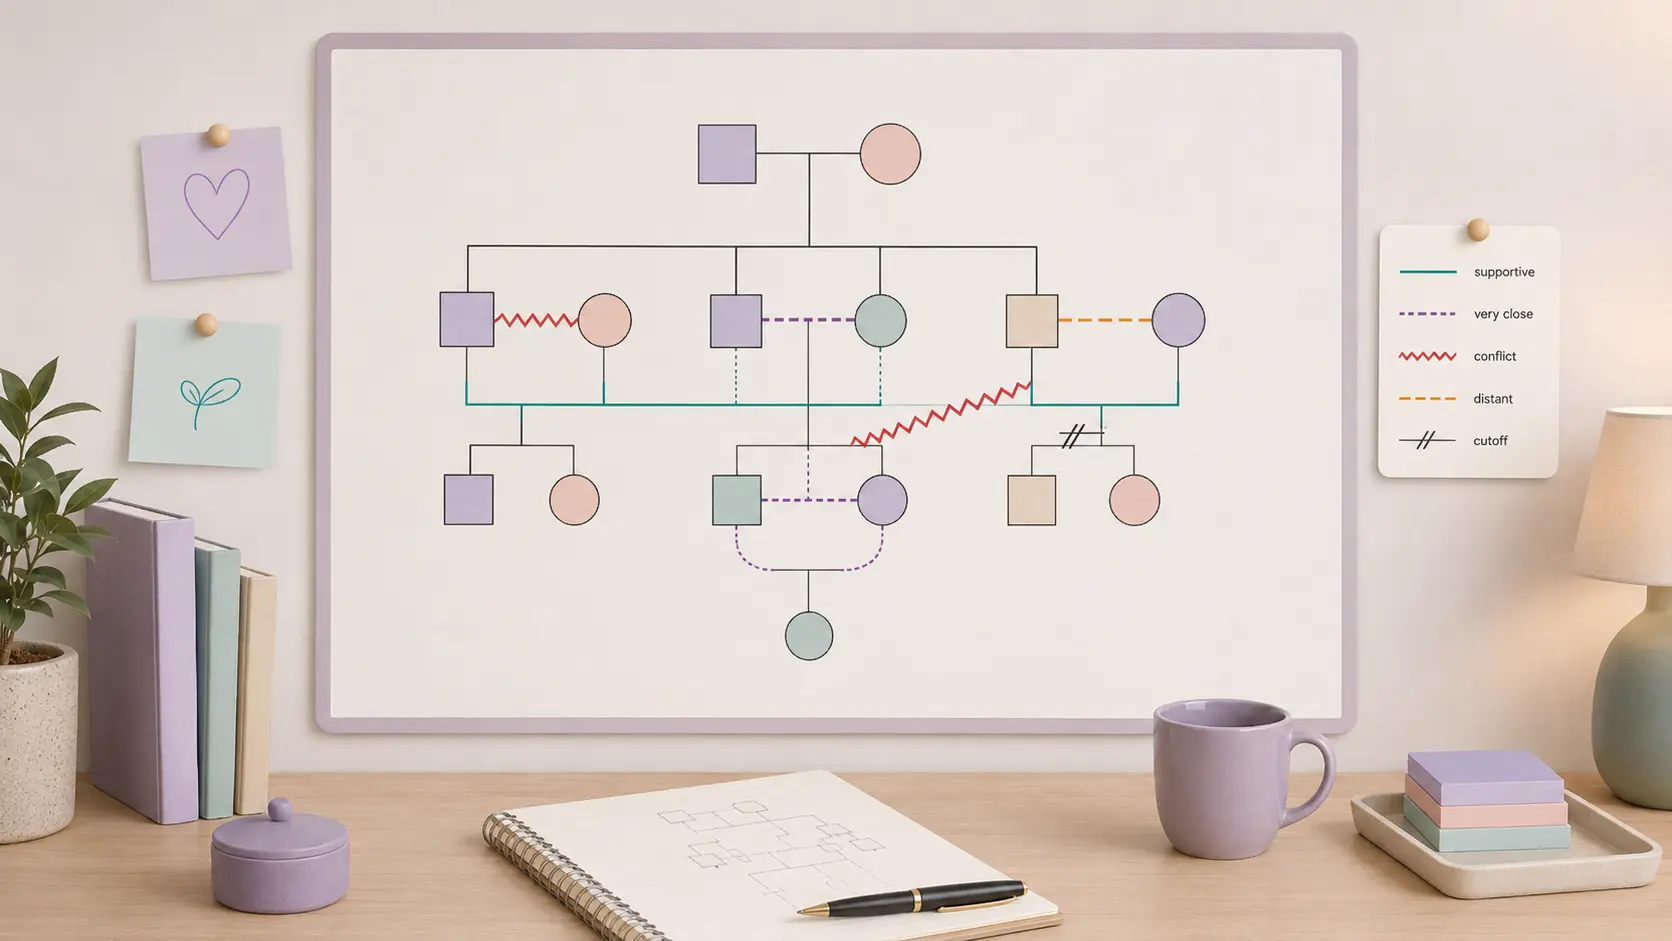
Emotional relationships are often harder to understand than family structure alone. These emotional genogram examples show how to map closeness, support, conflict, distance, cutoff, fusion, and other relationship patterns across a family. Use them to choose the right structure for a counseling case, social work assessment, family studies assignment, or personal reflection, then replace the sample information with the relationships relevant to your purpose.
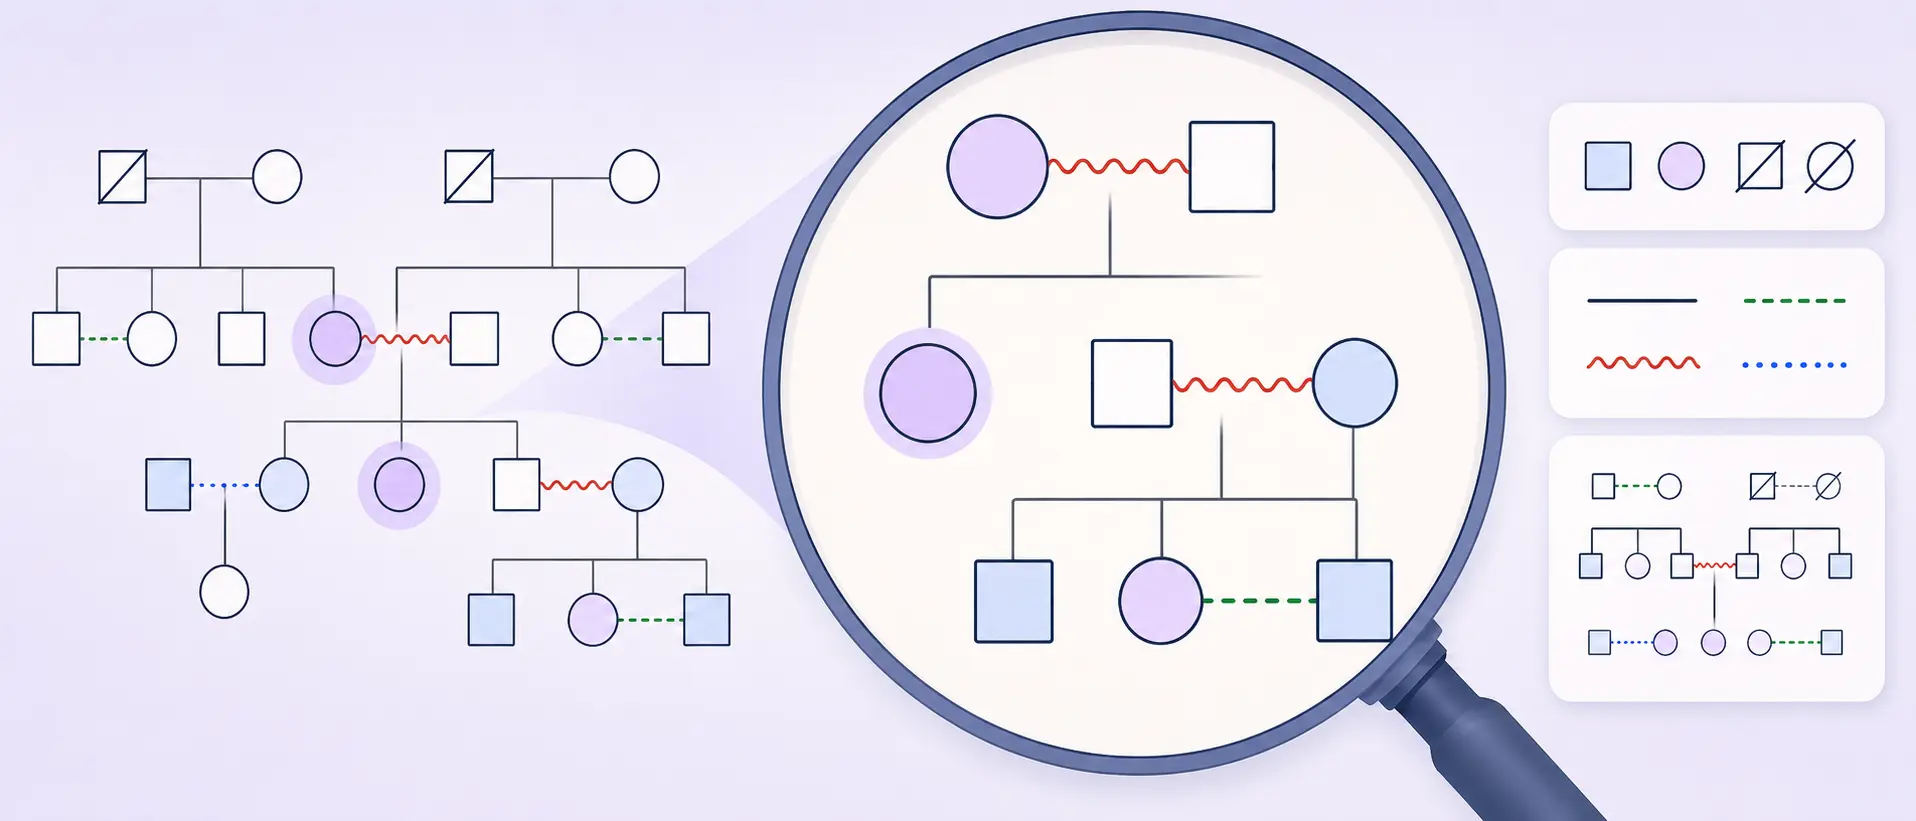
A genogram can look confusing at first, with different symbols, lines, dates, notes, and relationship markers spread across several generations. But once you know what to look for, it becomes much easier to read. In this guide, we explain how to read a genogram step by step, including its structure, symbols, relationships, life events, and patterns.
You avoid conflict. You overthink relationships. You feel responsible for everyone. You struggle to rest. You choose the same type of partner.
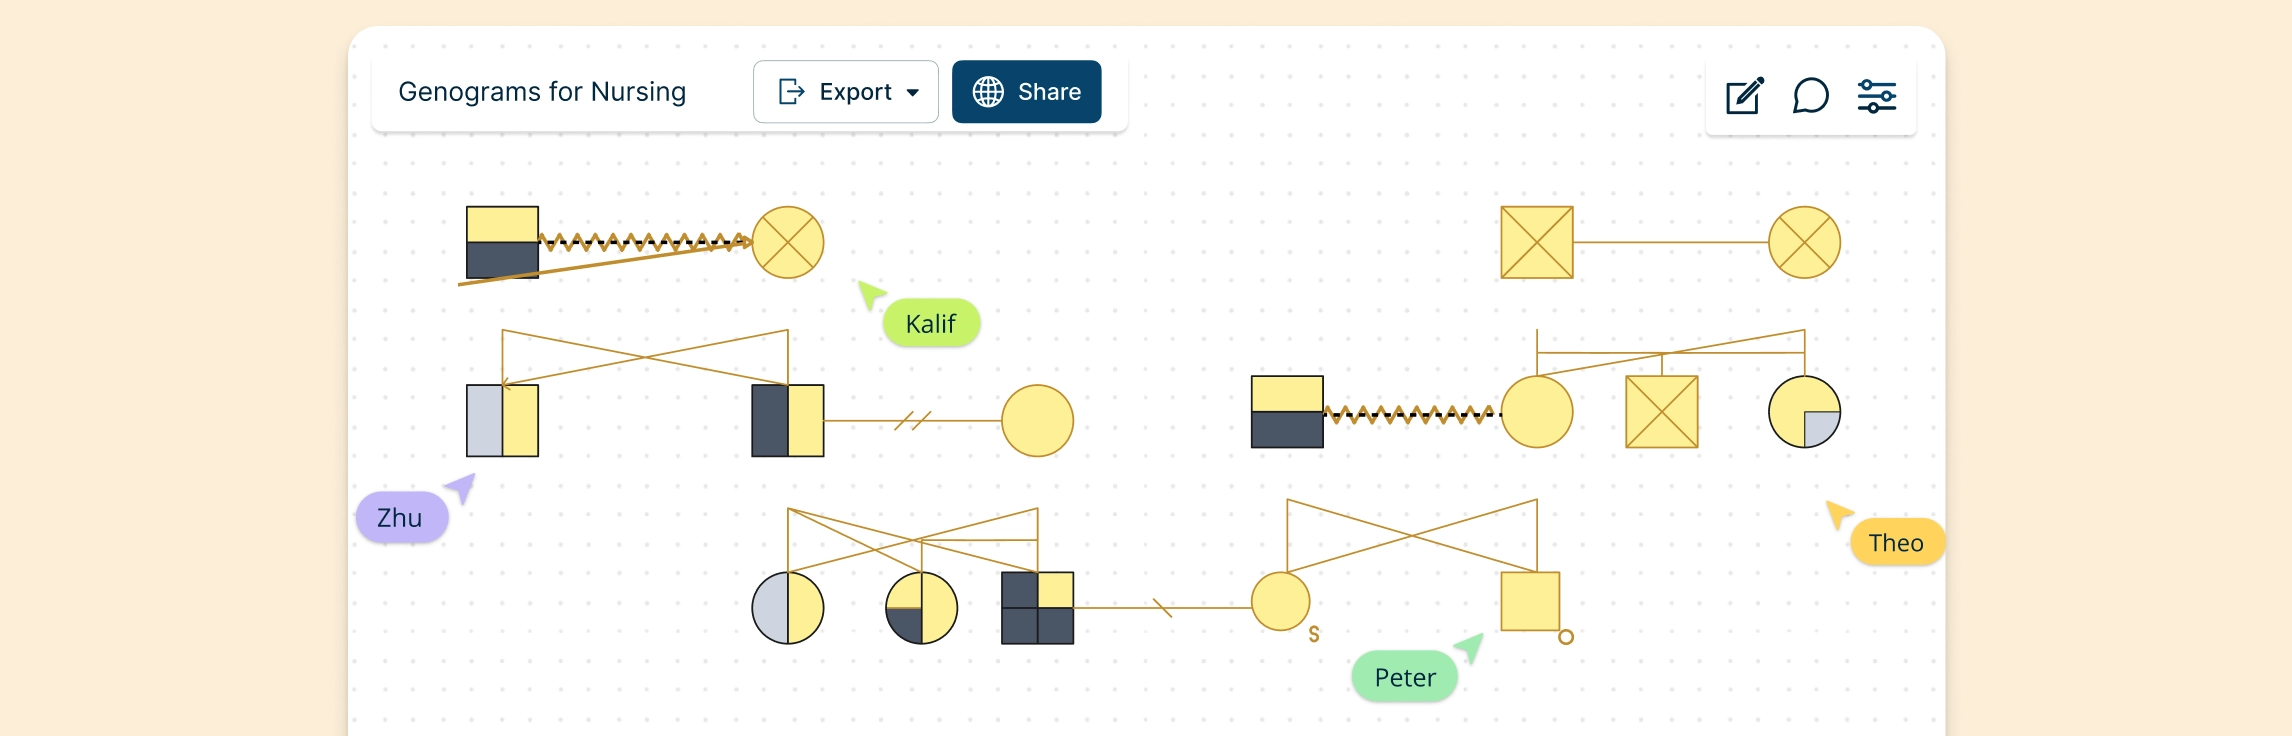
Not sure what a genogram for nursing students should include or how it should look? The eight examples below show how to organize family members, health conditions, causes of death, caregiving roles, and important relationships for different nursing assignments. Choose the example that best matches your task, then customize it in Creately instead of starting from scratch.
Not sure which relatives, relationships, or family patterns belong in your assignment? These genograms for psychology and counseling students show you what to include, how to structure the diagram, and which patterns to analyze. Start by choosing the example that best matches your assignment brief.
Family trees help people understand family connections, preserve family history, and see how generations are linked over time. Whether you are exploring your ancestry, organizing family information, or simply learning more about your roots, understanding what a family tree is can make the bigger picture much clearer. In this guide, you’ll learn what is a family tree, what it shows, why it matters, and how it is different from other family diagrams like pedigree charts and genograms.
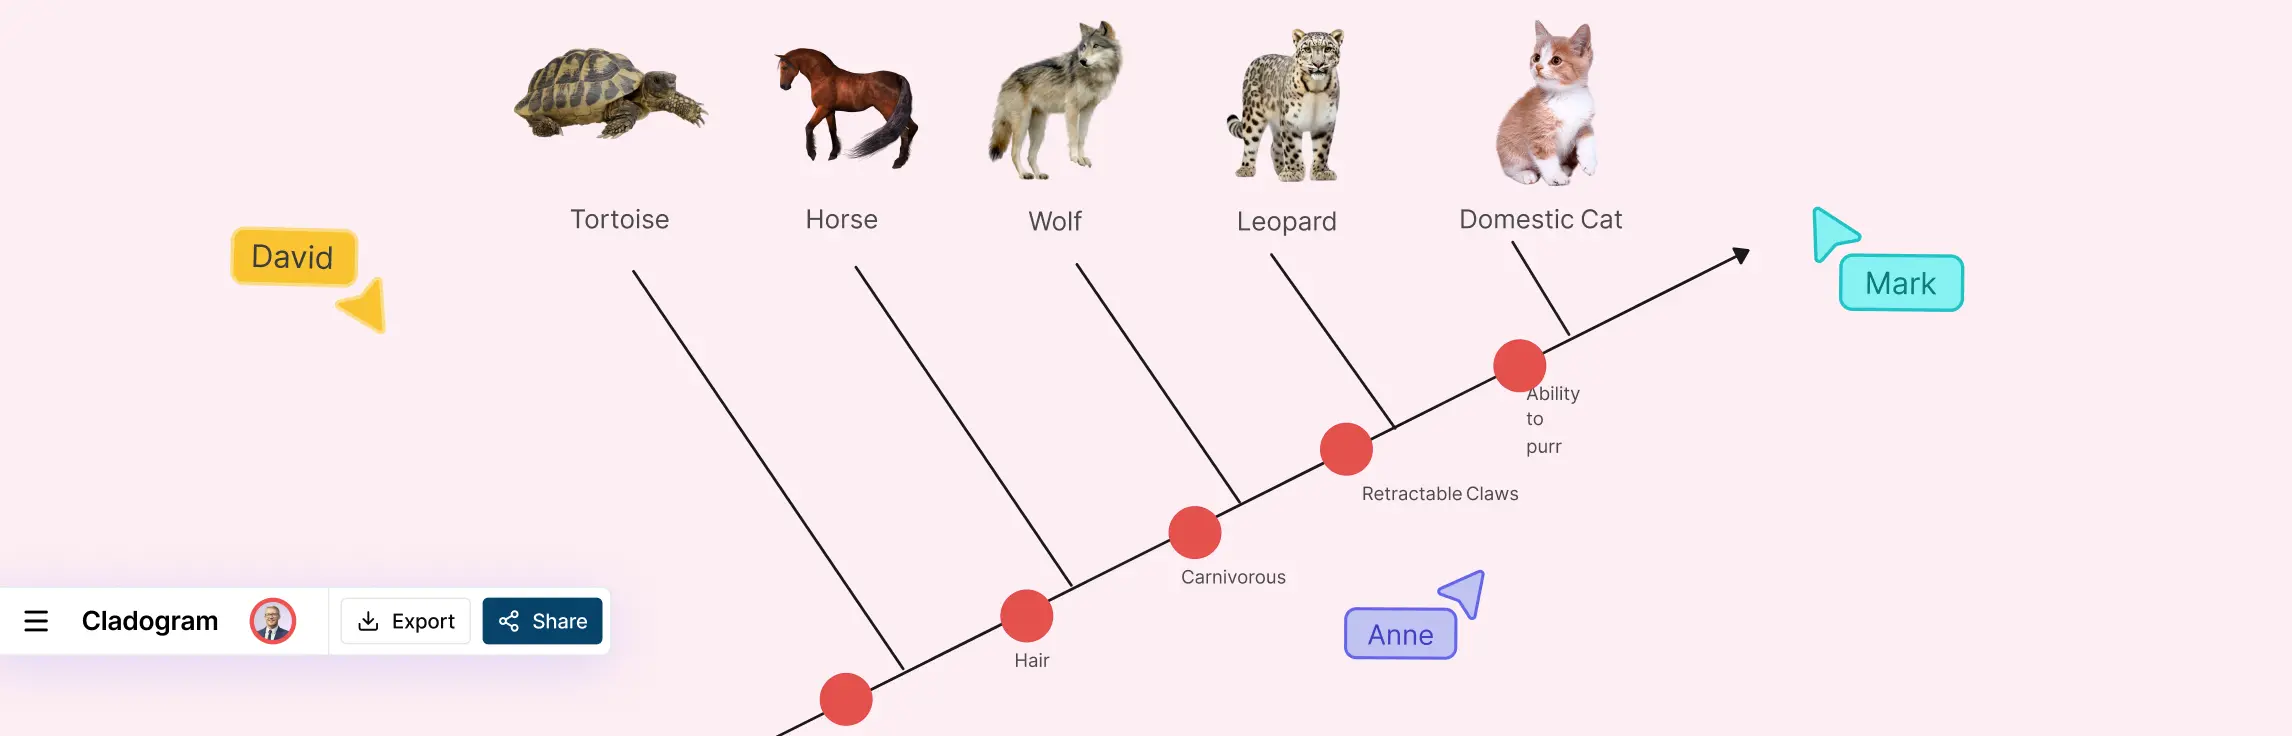
Struggling to turn scattered evolutionary data into a clear, professional visual? You aren’t alone. Our guide simplifies how to create a cladogram using a logical, step-by-step framework. From building character tables to using collaborative templates, discover how to move from messy notes to visual clarity by mapping complex evolutionary relationships with speed and precision.
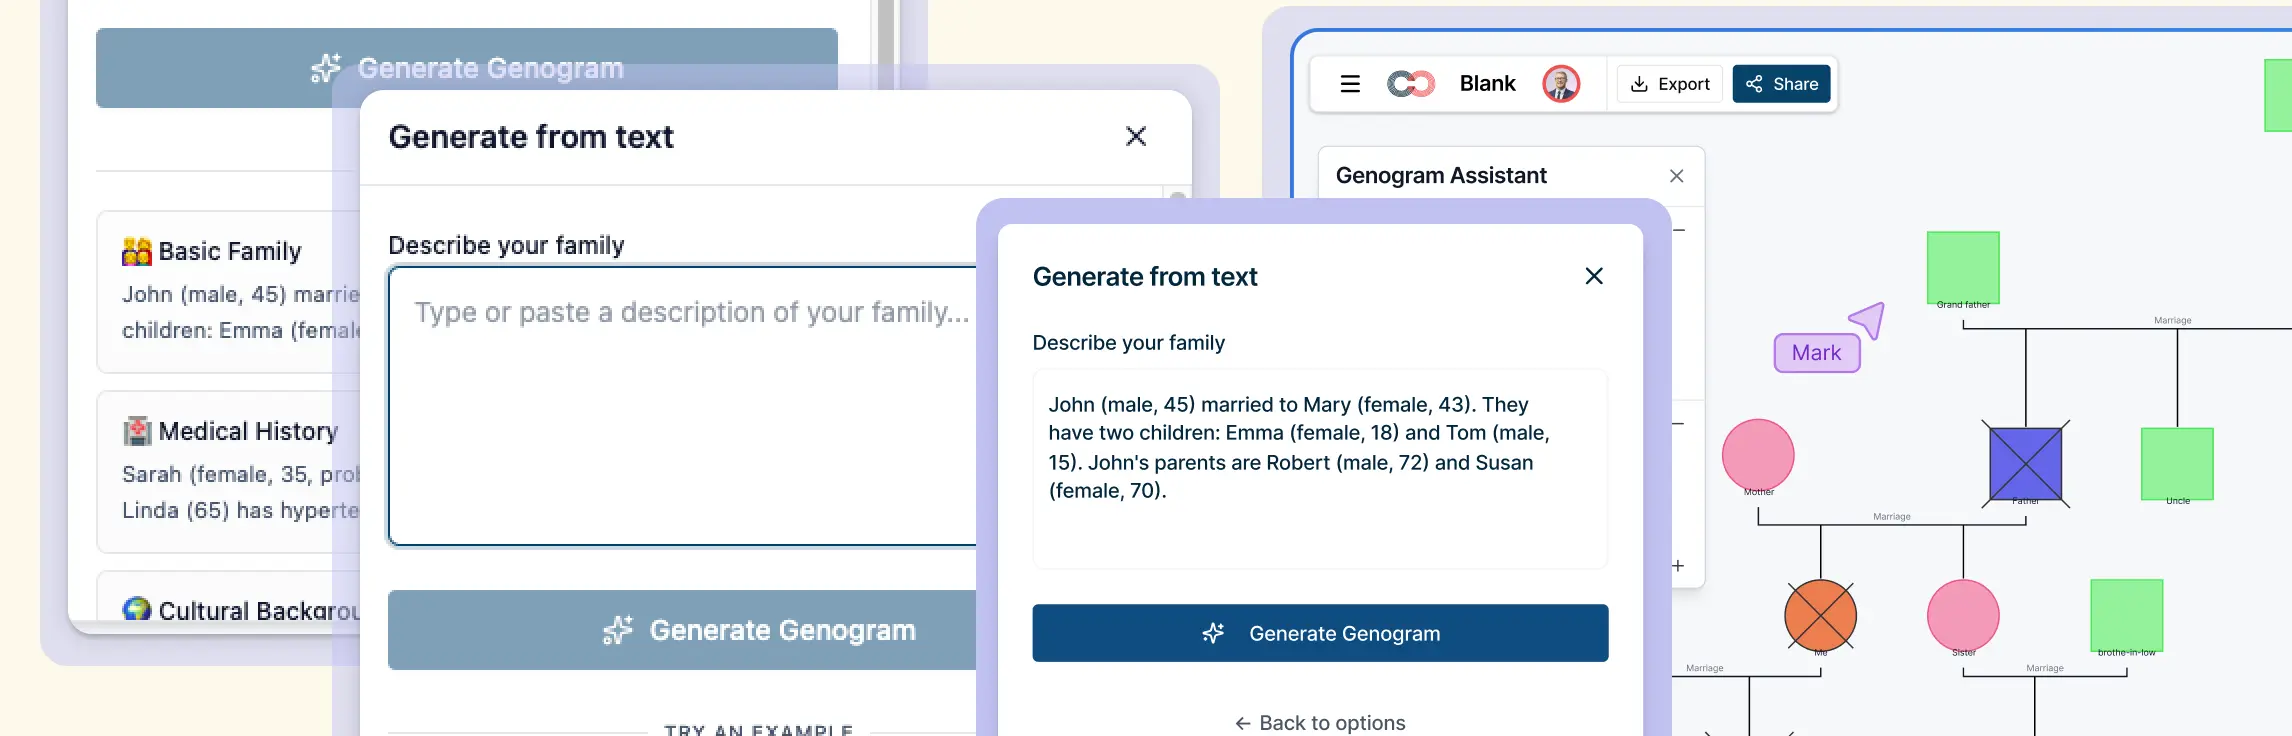
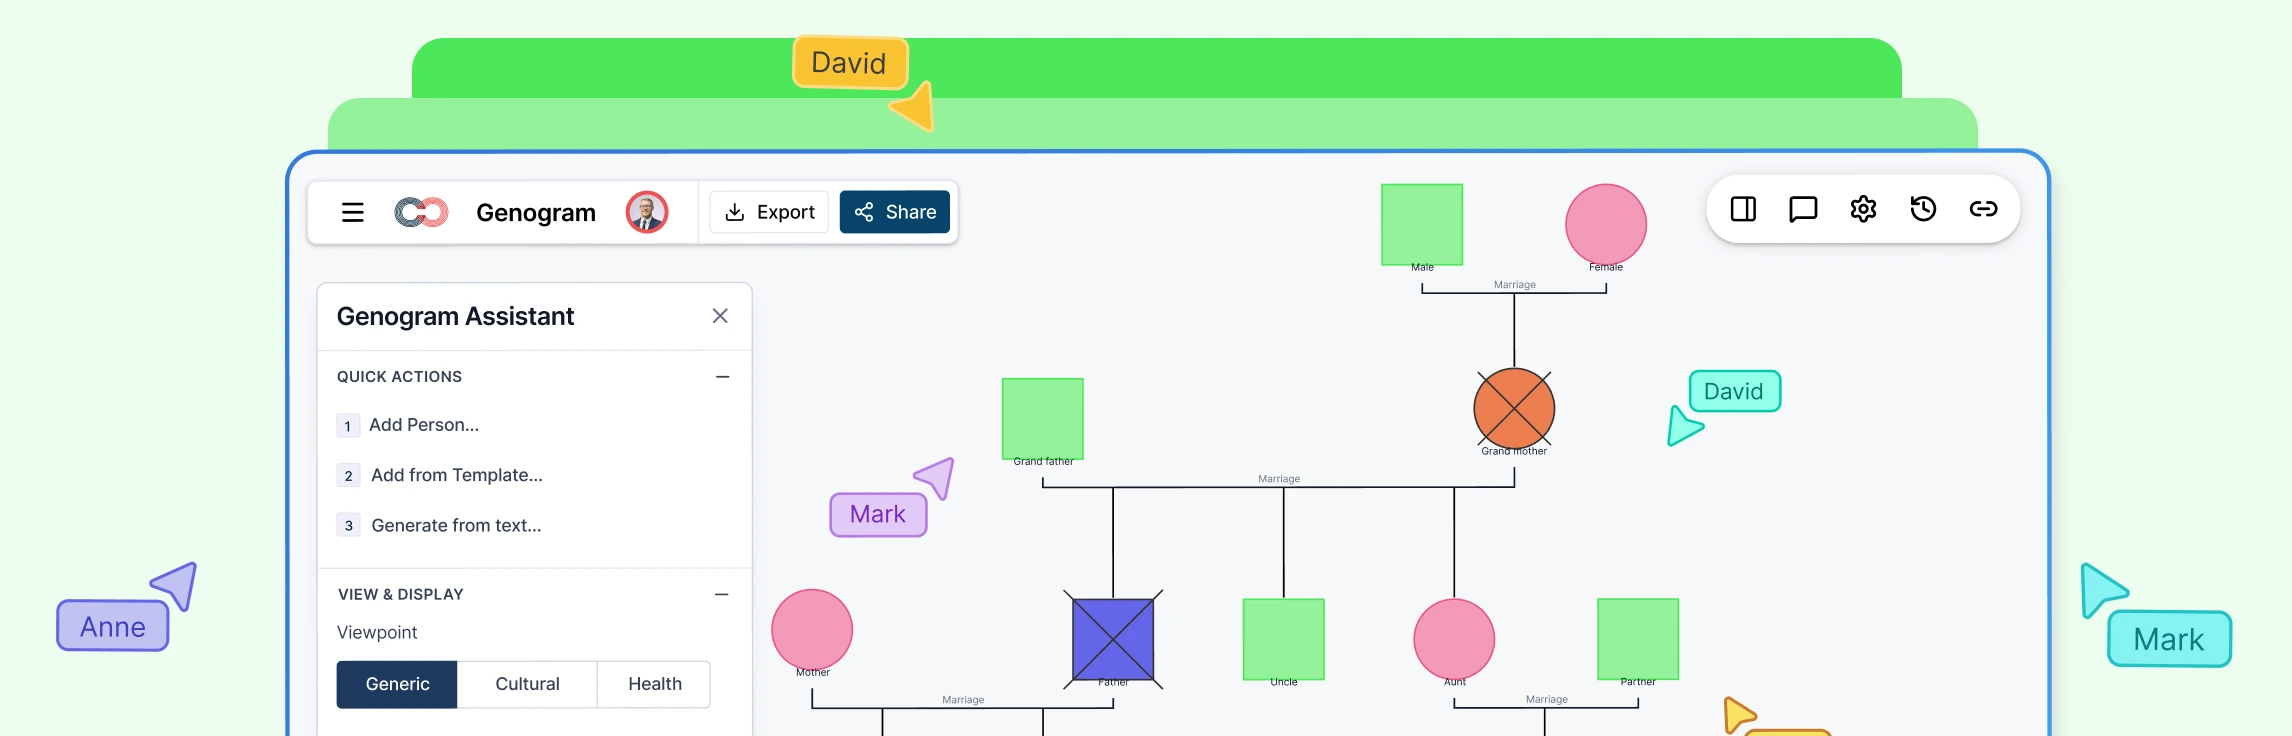
Creating a genogram manually can be slow and disruptive — especially when working from scattered notes or complex multi-generational family histories. Translating written information into structured symbols and relationships often means building the diagram after the session instead of during it.
Genograms are widely used in research and professional practice to analyze patterns across families. But when each case is documented differently, comparing genograms becomes difficult. Missing data fields, unclear relationship details, and undocumented sources can reduce the reliability of family datasets, even when a genogram looks visually complete. A genogram data completeness score helps researchers evaluate whether a genogram contains the structured information needed for analysis, assessment, or documentation.
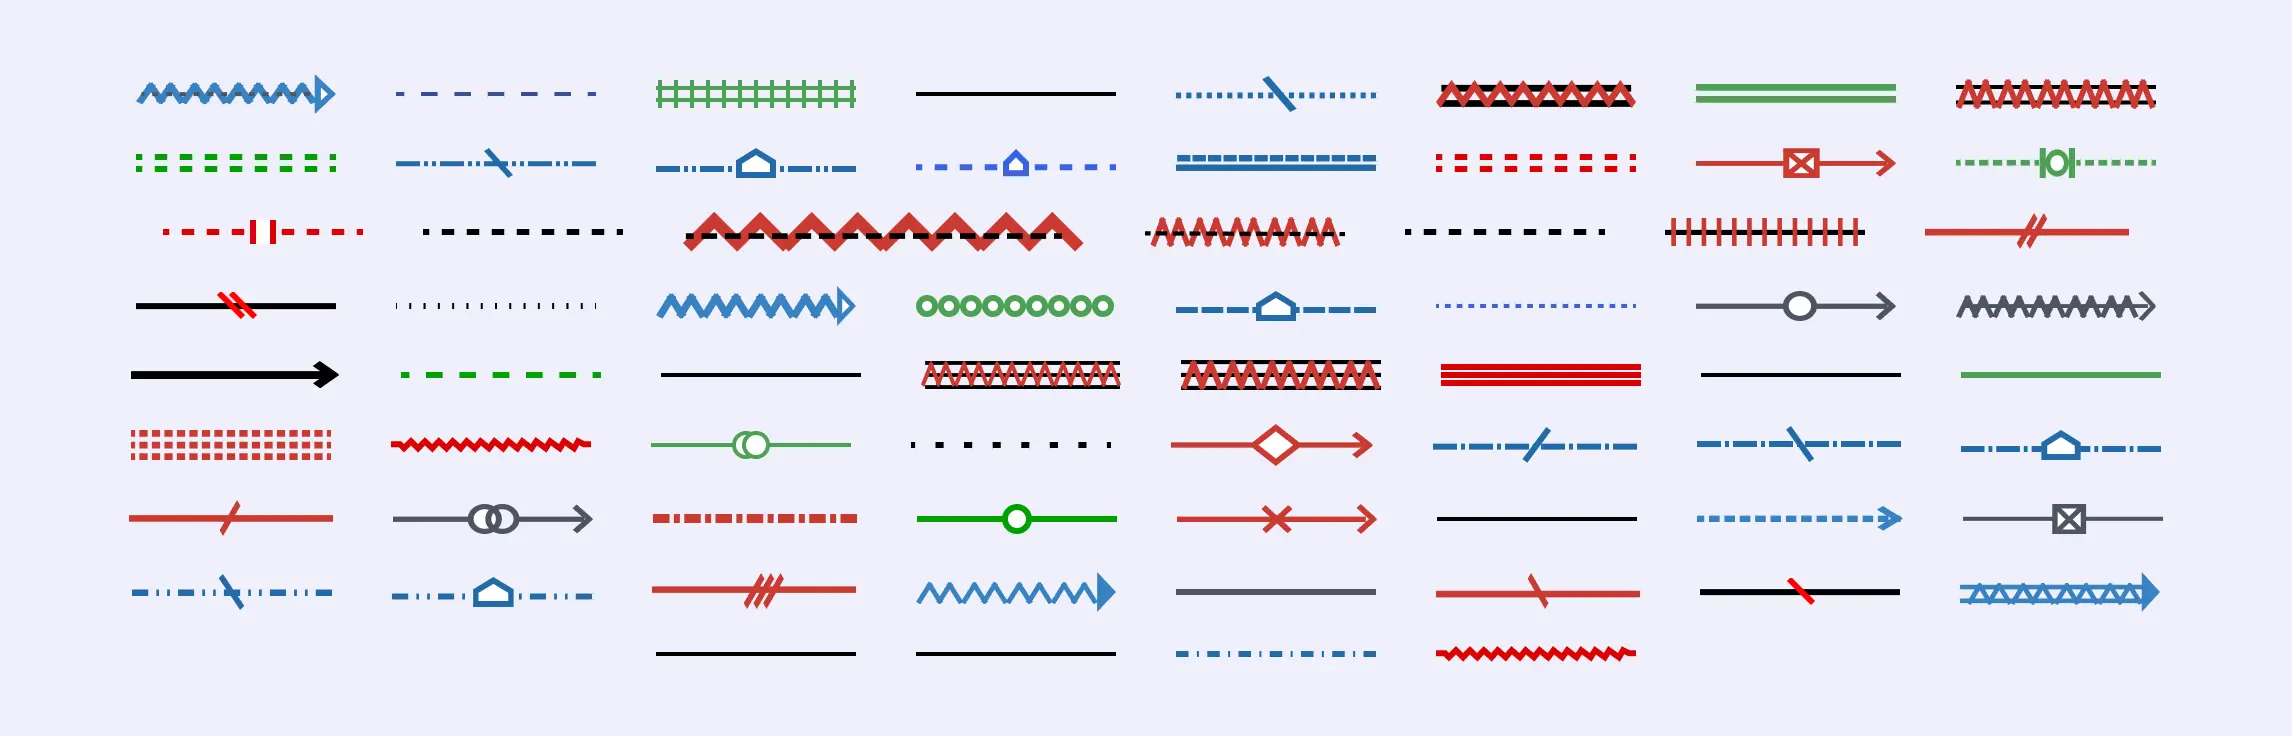
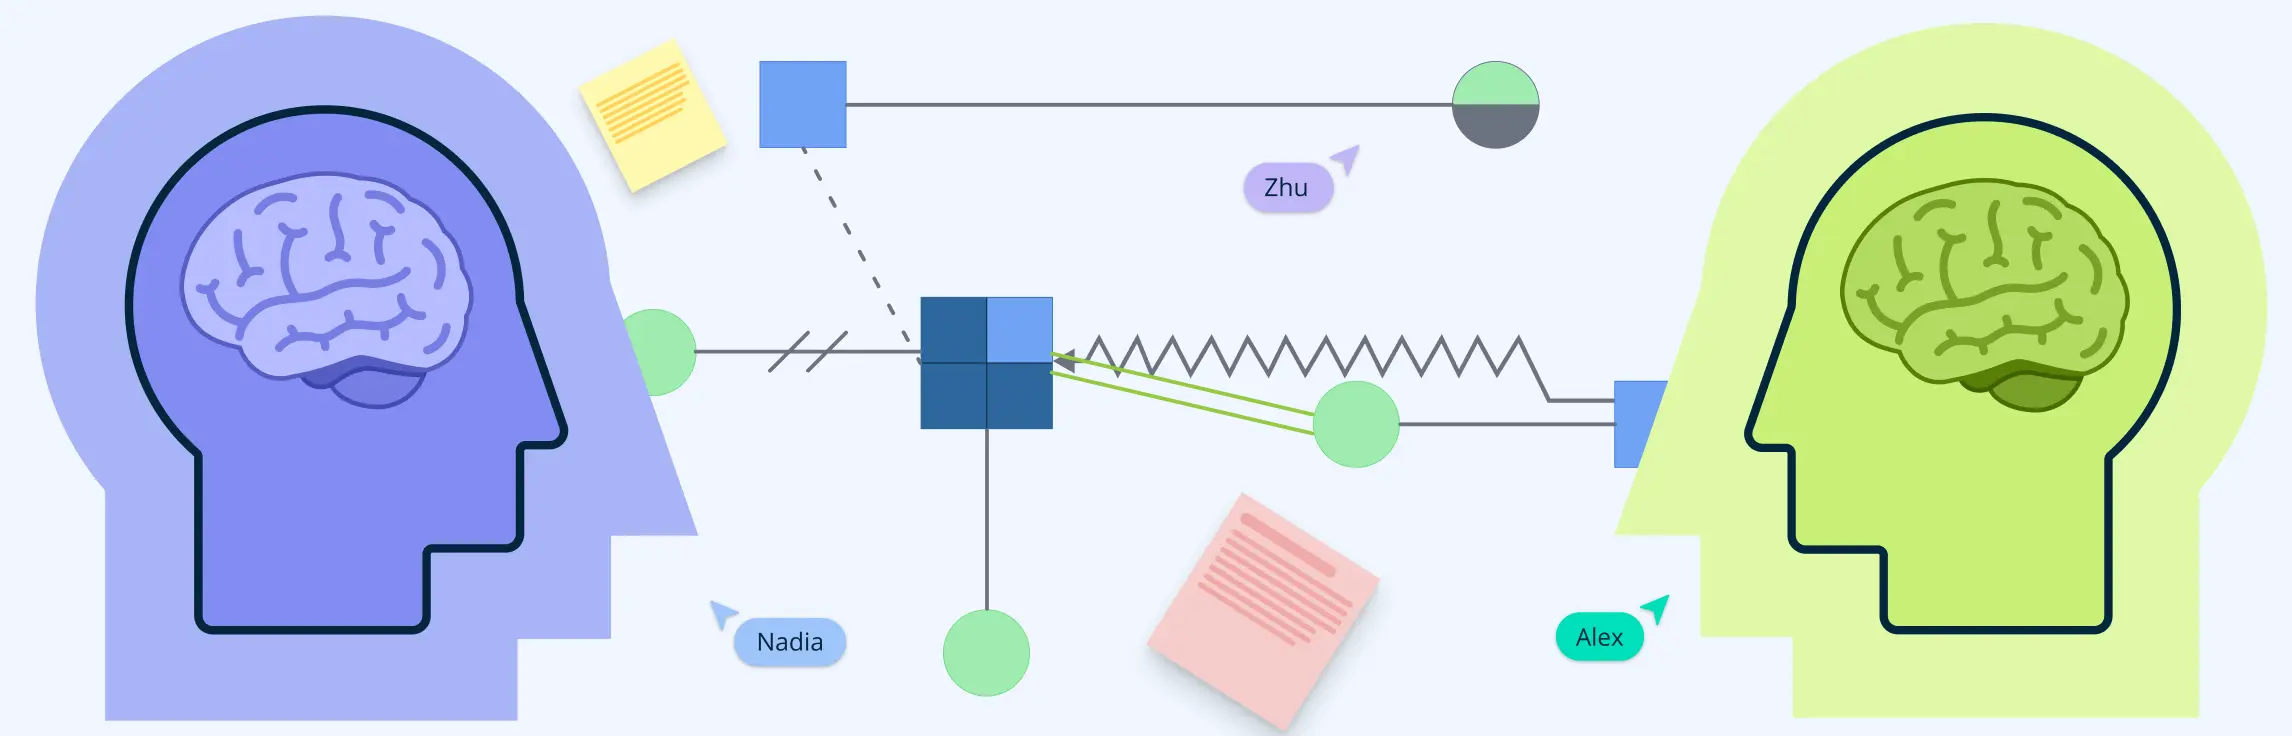
You may know the family story, but choosing the right genogram connector to represent it can be challenging. Genogram relationship line types help show how people in a family are connected and how they relate to each other emotionally and socially—from marriages and parent–child links to close bonds, conflict, or estrangement. By mapping these connections, genograms reveal patterns and dynamics that shape families across generations. The modern genogram method was formalized in the 1980s by family therapists Monica McGoldrick and Randy Gerson, who introduced standardized genogram symbols to analyze family relationships and intergenerational patterns.
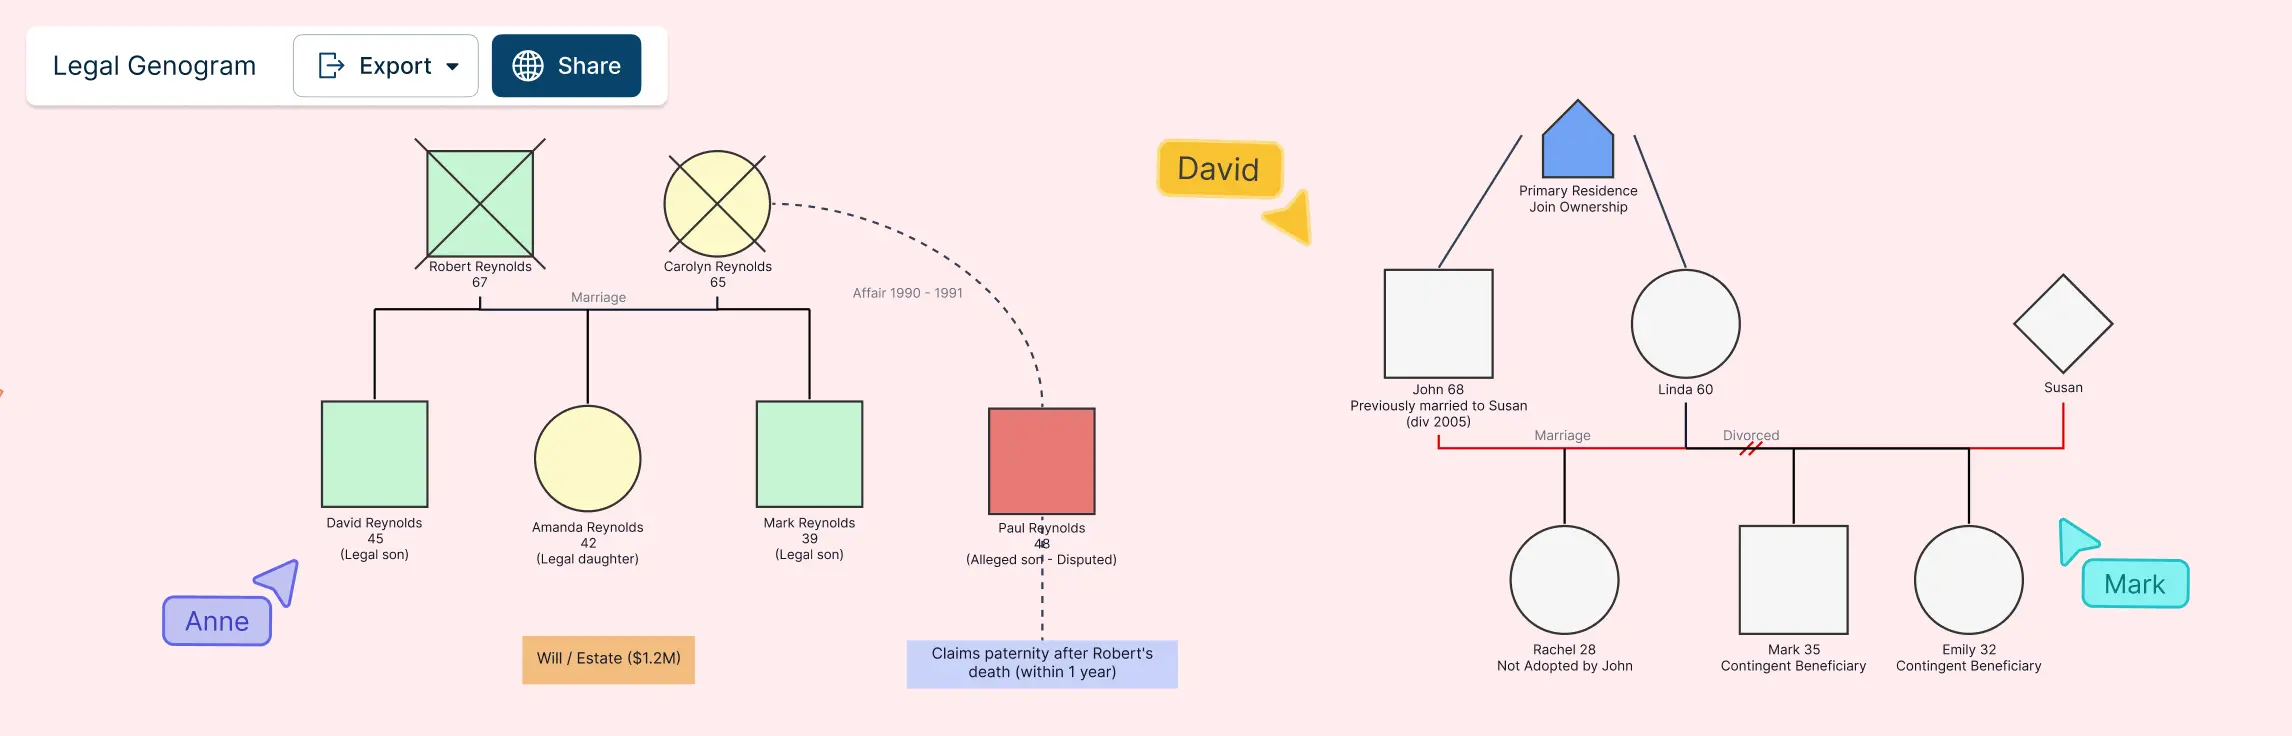
Estate planning and family law cases are more complex than ever. Second marriages, blended families, beneficiary-driven assets, and layered guardianships create real risk. Overlooked stepchildren can trigger probate disputes. Conflicting beneficiary designations can override a carefully drafted will.
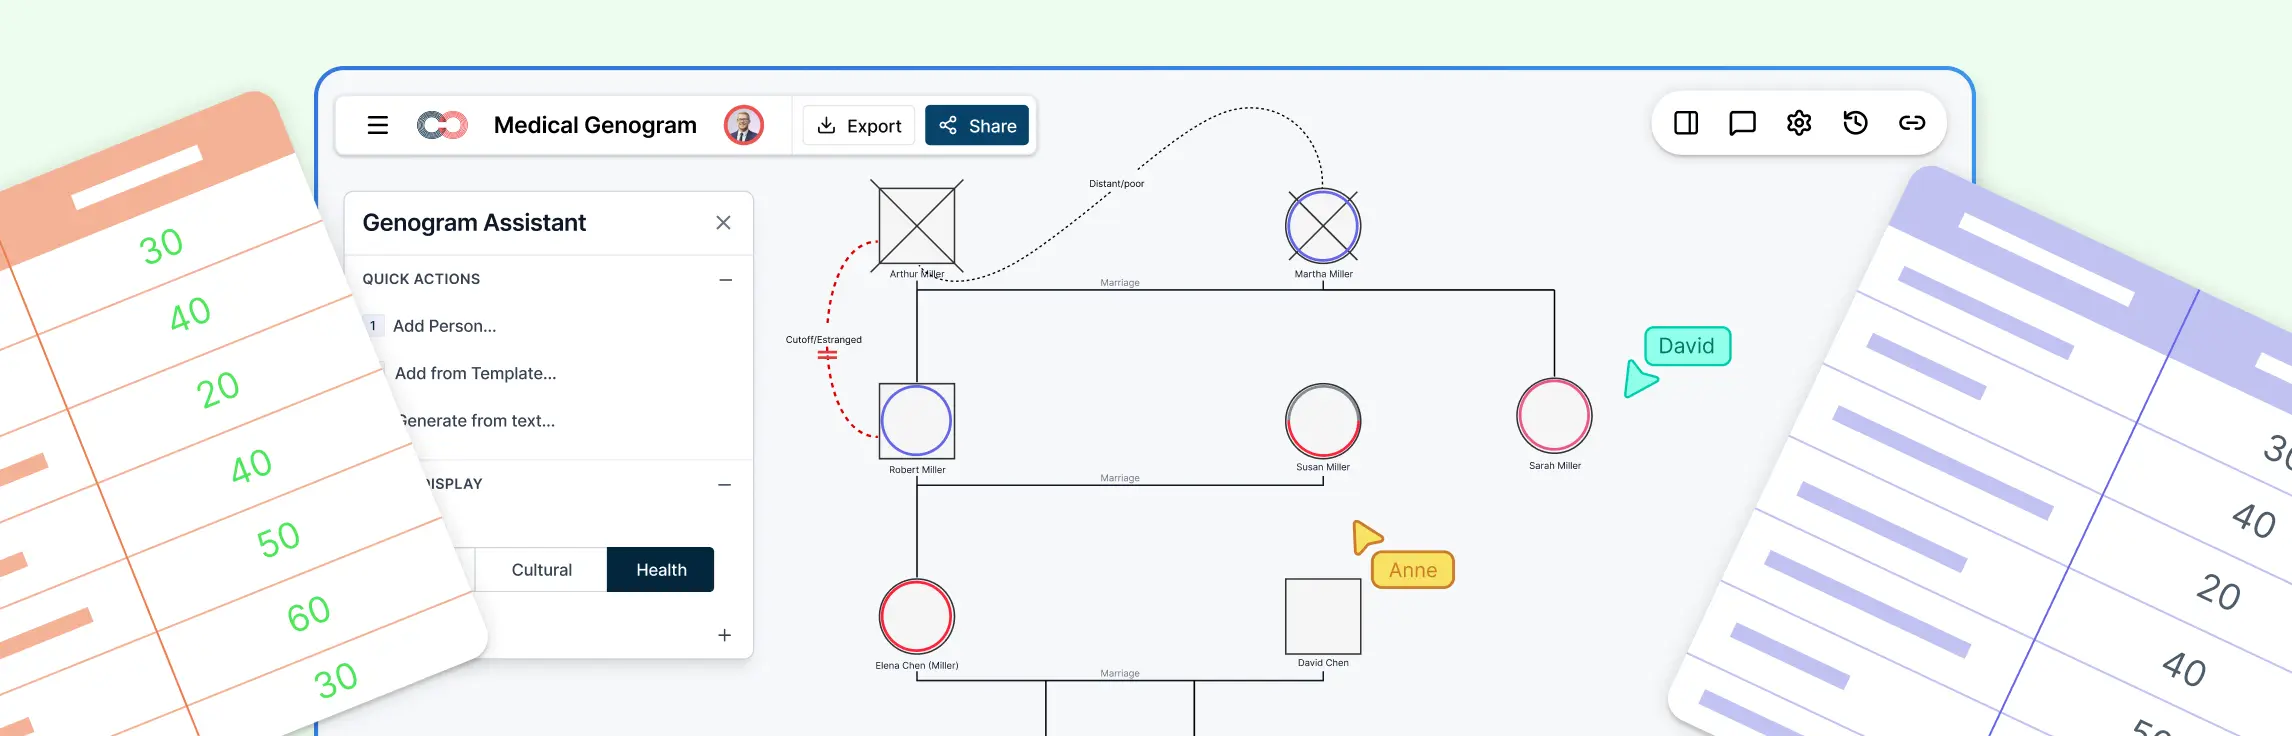
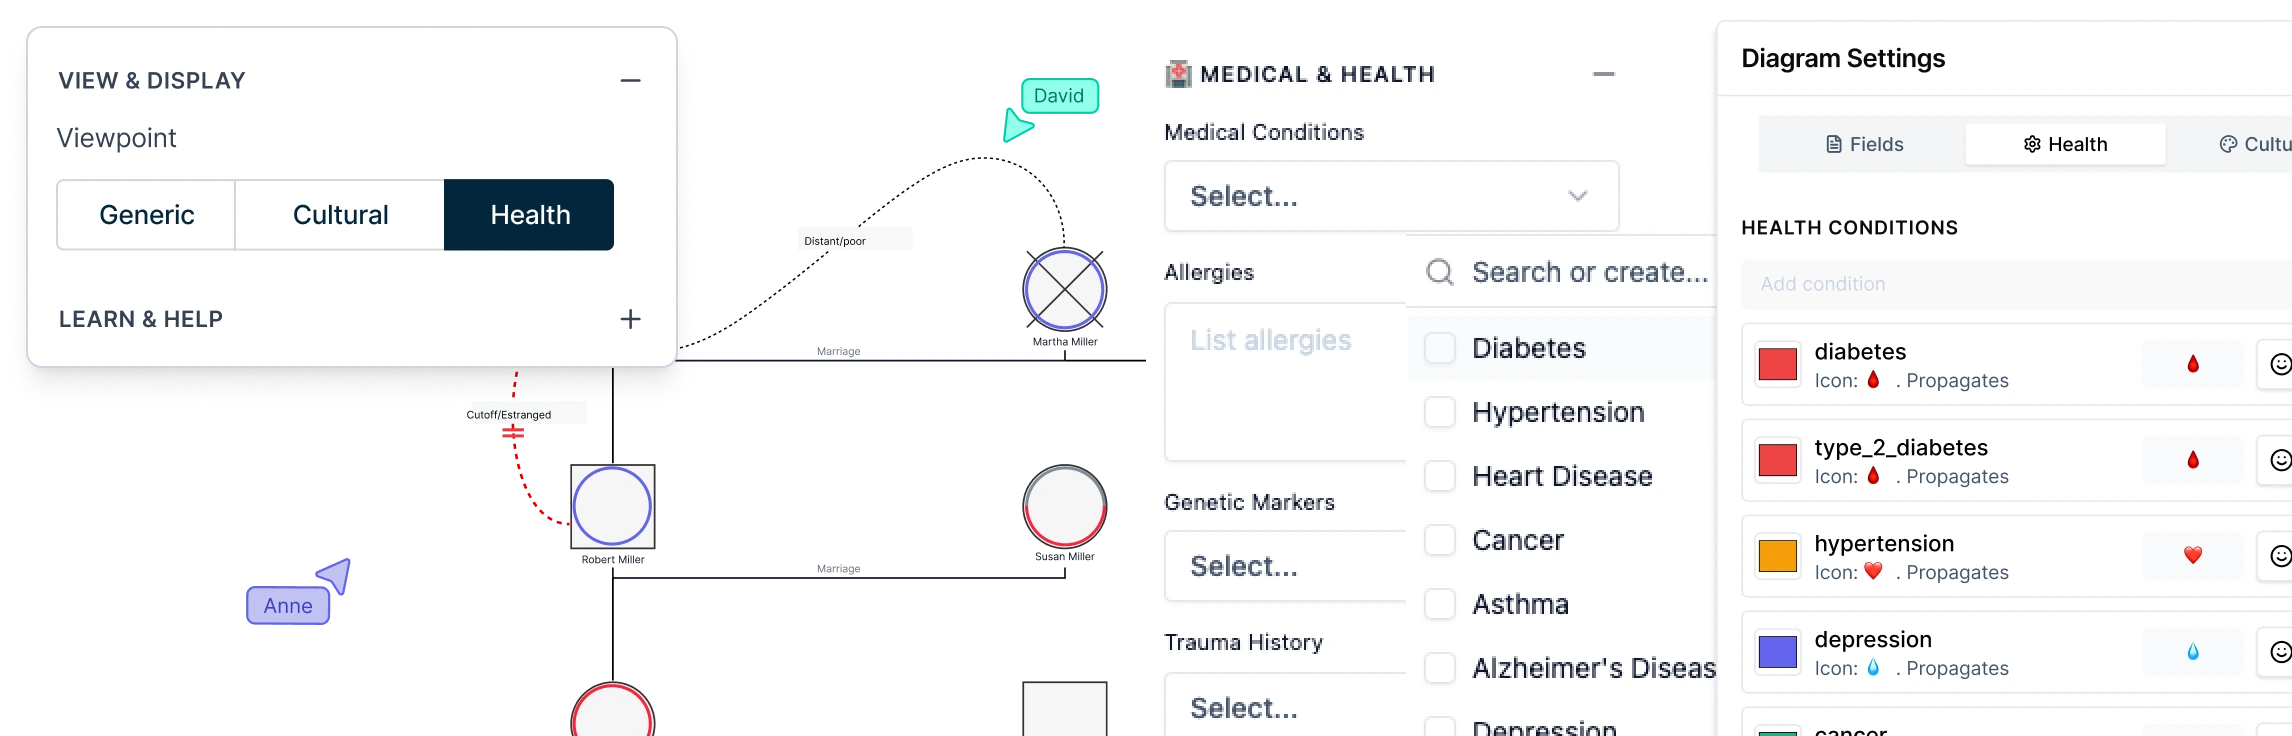
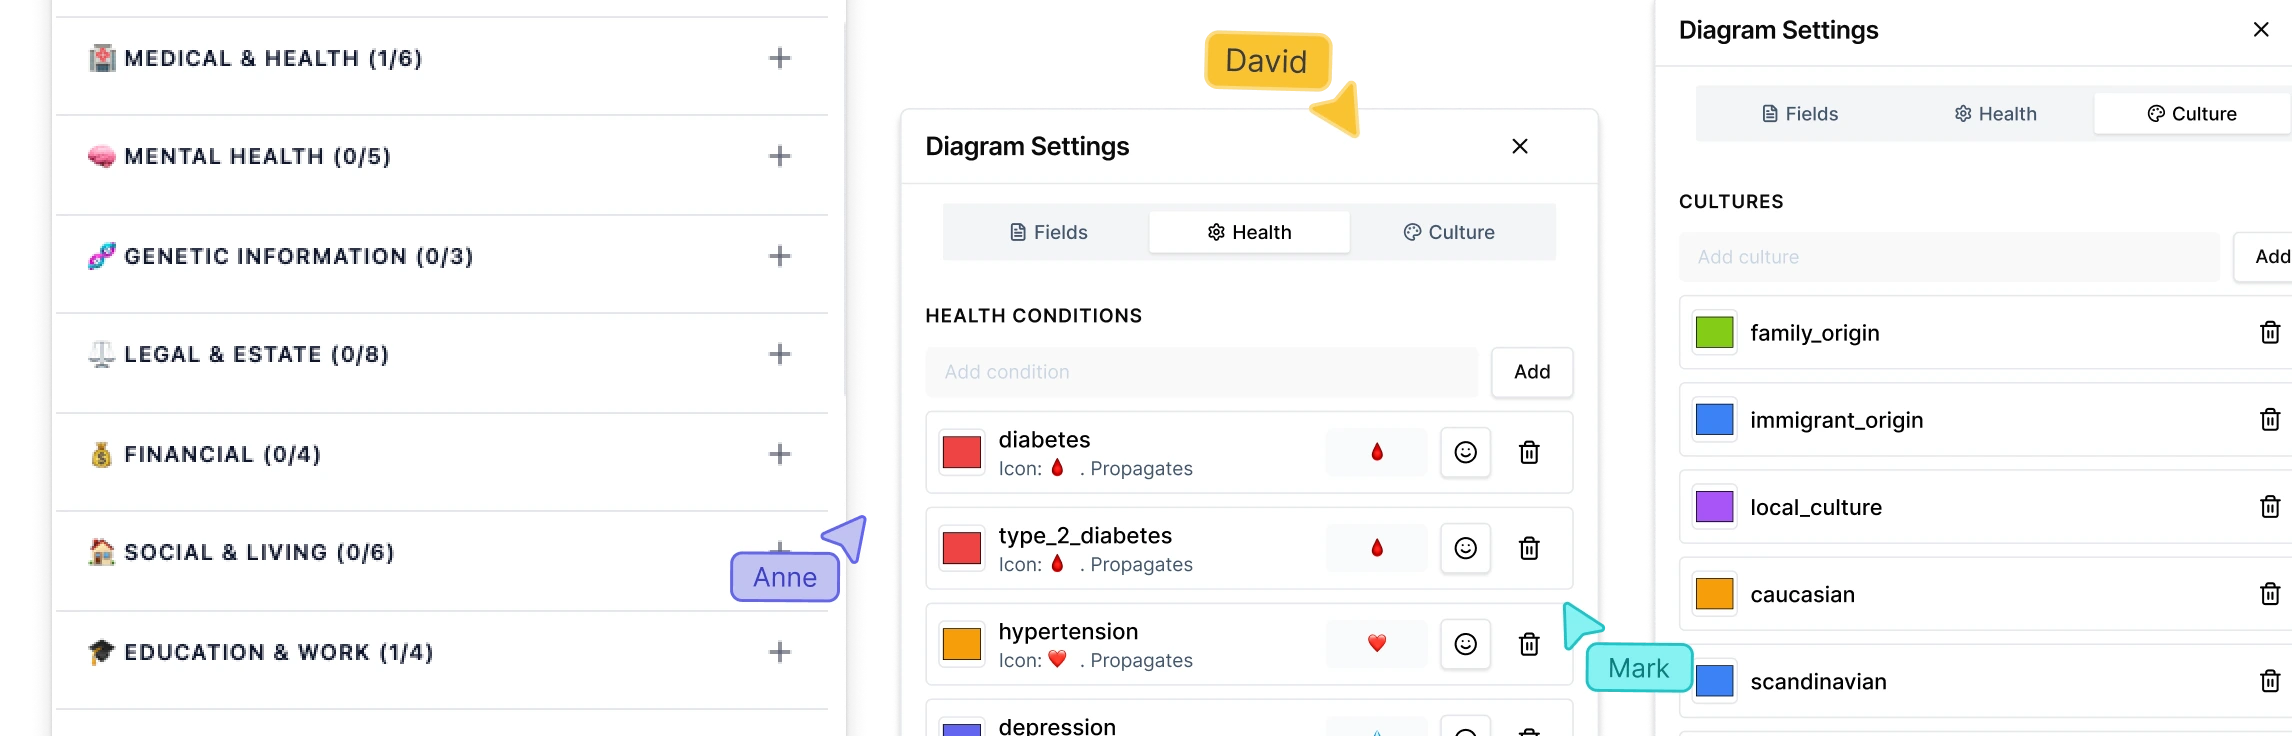
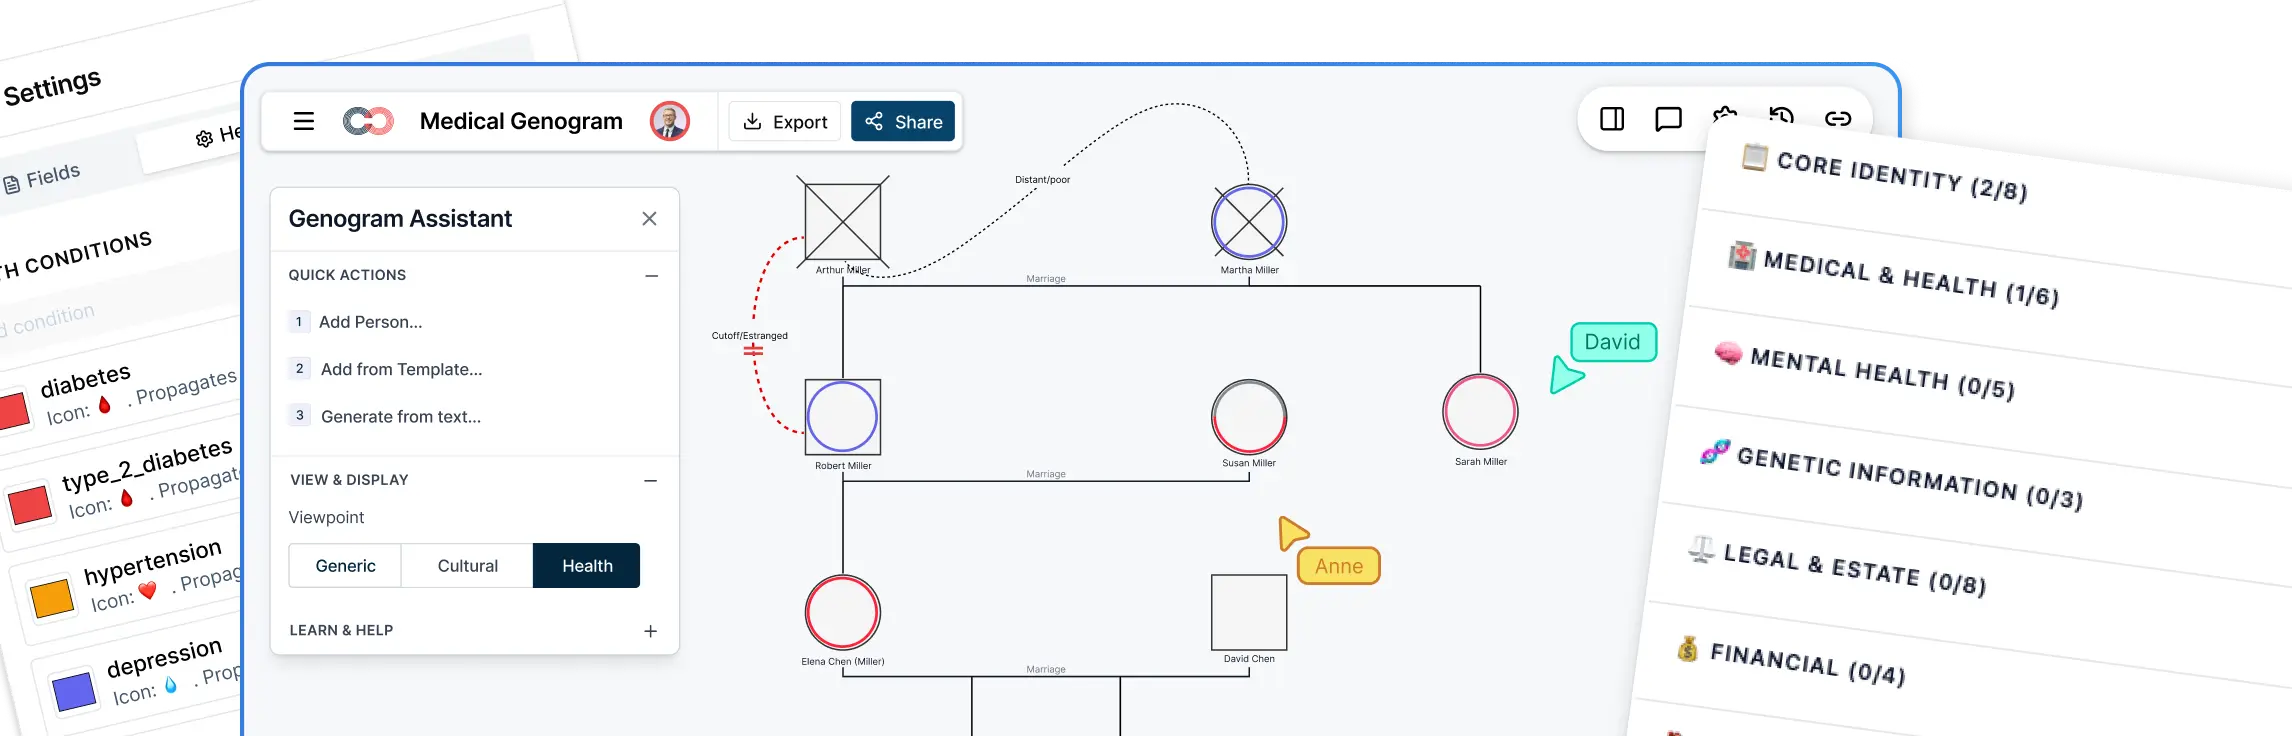
When you review family health history, the hardest part is not capturing conditions. It’s spotting inherited risk across generations quickly. Genogram Health View mode helps you see those patterns at a glance by color-coding conditions across the family. In this guide, you’ll learn how to add the right medical data for a genogram health assessment, turn on Health View, and use it to review hereditary patterns faster during genetic counseling and clinical preparation.
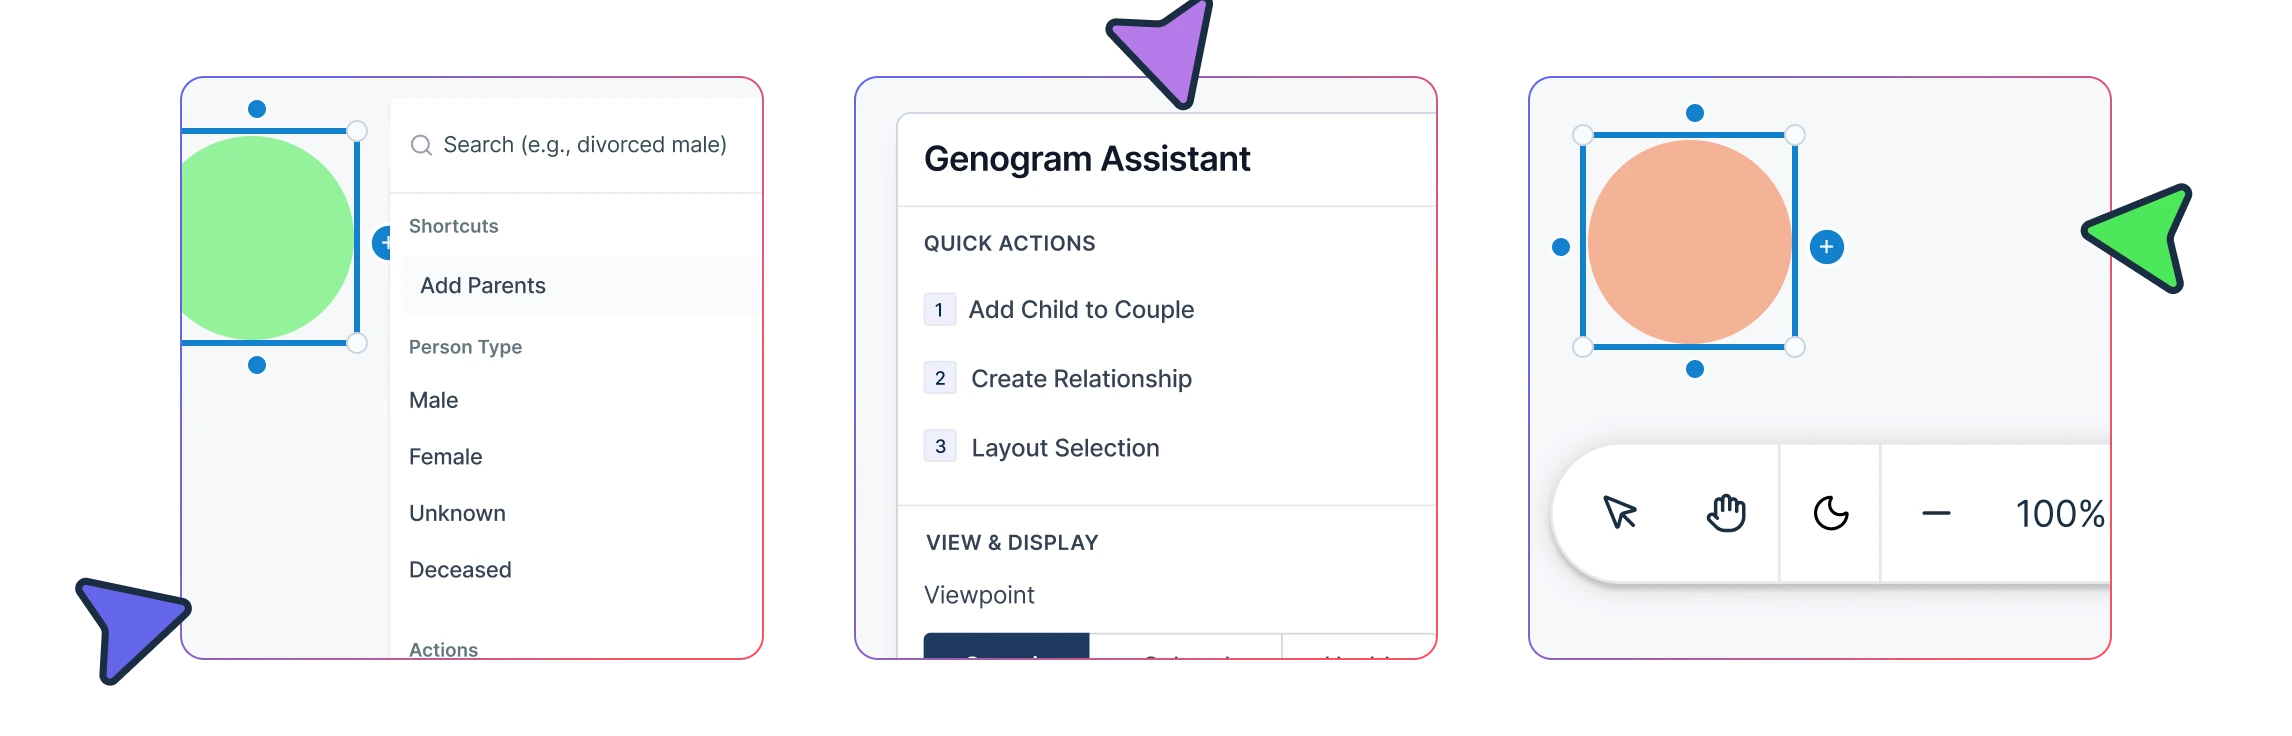
Building a genogram live is hard when you’re listening, asking follow‑up questions, and documenting at the same time. In this guide you’ll learn the 1–5 shortcut system for adding relatives, relationship shortcuts, and ways to move around the canvas fast so you can keep the conversation flowing.
Family systems are complex, and every profession looks at them differently. Genetic counselors focus on hereditary disease patterns, therapists explore emotional dynamics, and social workers track risk factors and living conditions. Genogram field packs solve this by letting you activate only the data fields relevant to your work, making it easier to create a genogram for different professions.
Genetic counselors rely on family history to assess hereditary disease risk, but scattered intake forms and handwritten sketches often make it difficult to identify patterns. A genetic counseling genogram–also called a clinical pedigree–solves this by transforming complex history into a clear visual map. By moving to digital tools, counselors can build an accurate three-generation pedigree during the consultation, revealing inheritance patterns that might otherwise be missed. This guide explores how to move beyond manual drafting to prioritize clinical insight and patient care.
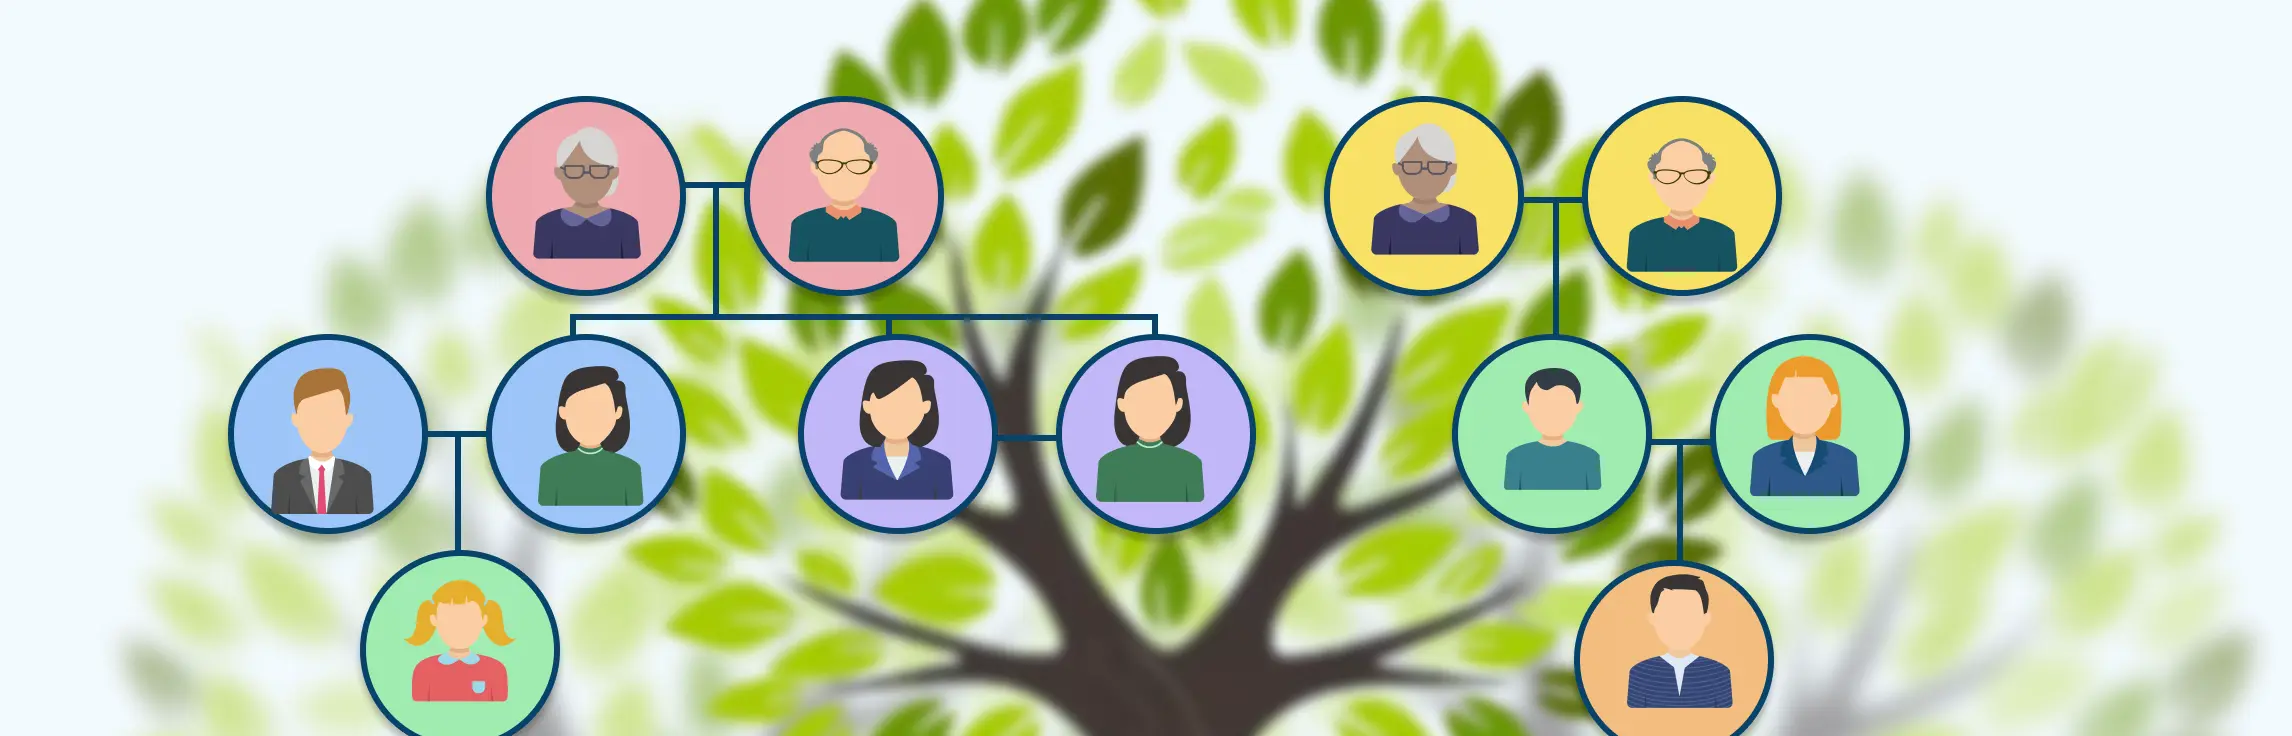
Keeping track of family connections can be confusing; names, relationships, generations, and stories often get scattered across notebooks, emails, or old photo albums. That’s where family trees come in: they turn complicated family histories into a clear, visual map that’s easy to understand. In this guide, we’ll explore the different types of family trees, why each format exists, and how to choose the right one for your purpose.
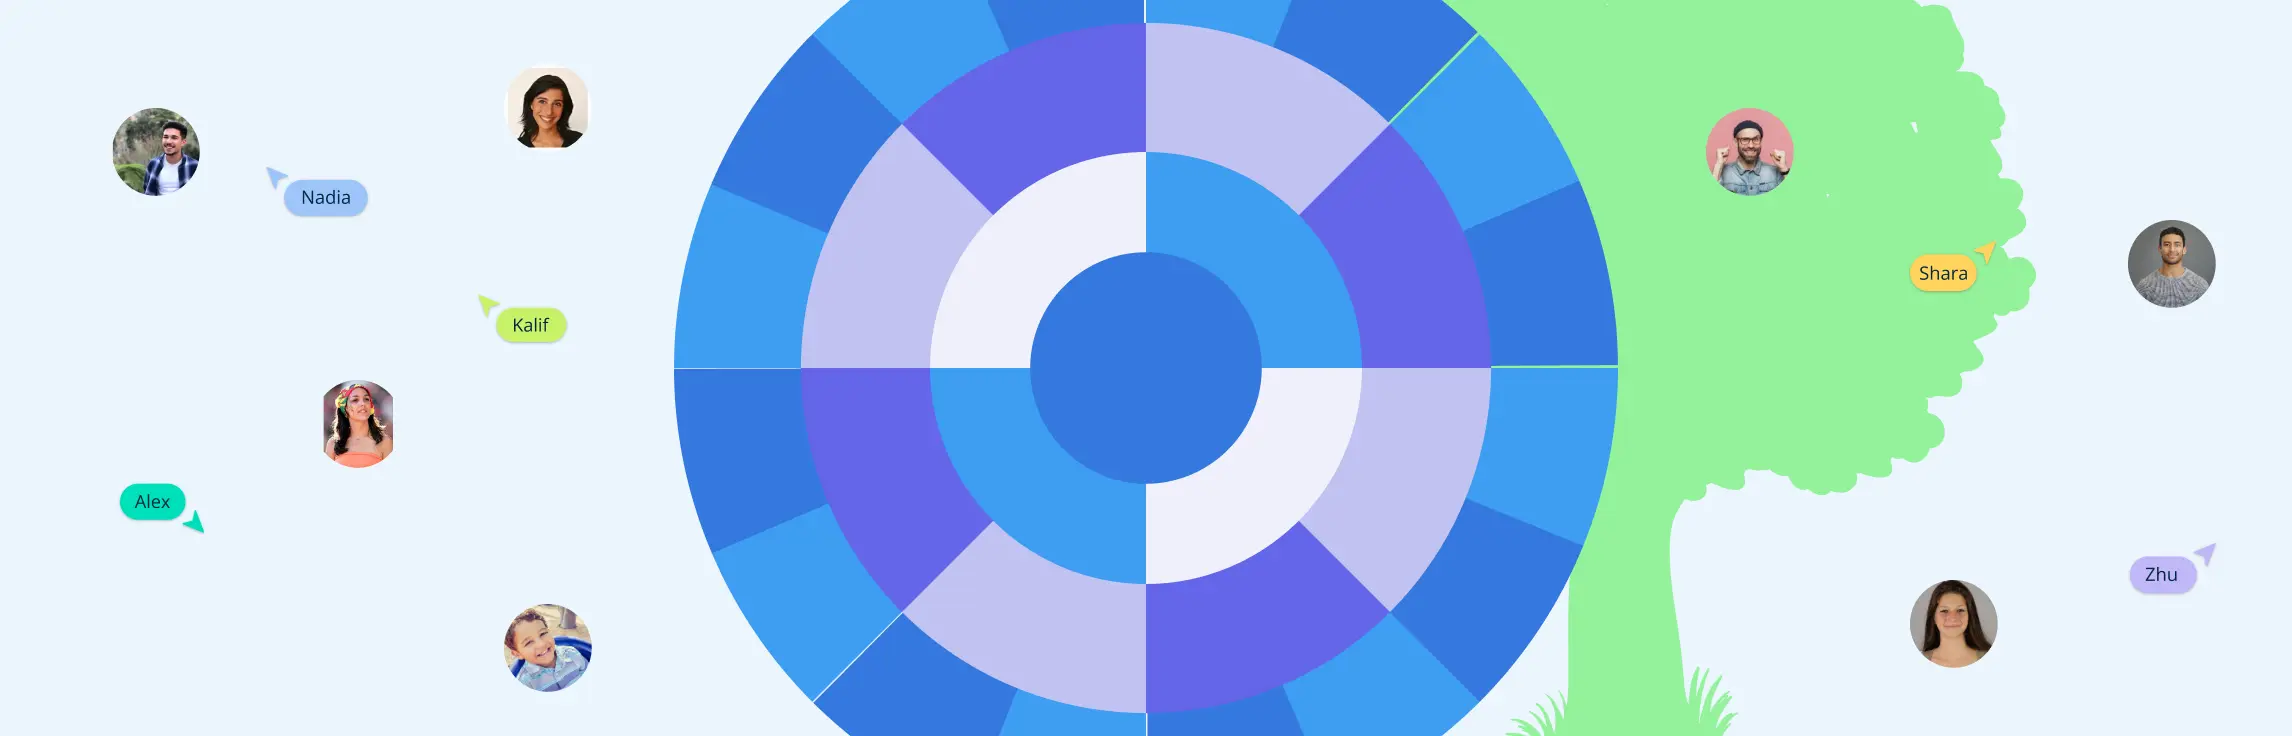
Tracking your family history can quickly become overwhelming. Traditional family trees often stretch endlessly, with branches crossing over each other and names getting lost in the clutter. If you’ve ever felt frustrated trying to make sense of a sprawling ancestry chart, you’re not alone. That’s where a circular family tree comes in. By arranging generations in concentric rings around a central person, this layout offers clarity, visual balance, and an intuitive way to explore your lineage. In this guide, we’ll show you what a circular family chart is, how it works, the best free and customizable templates available, and tips to make your chart both beautiful and easy to read—all while helping you bring your family story to life effortlessly.
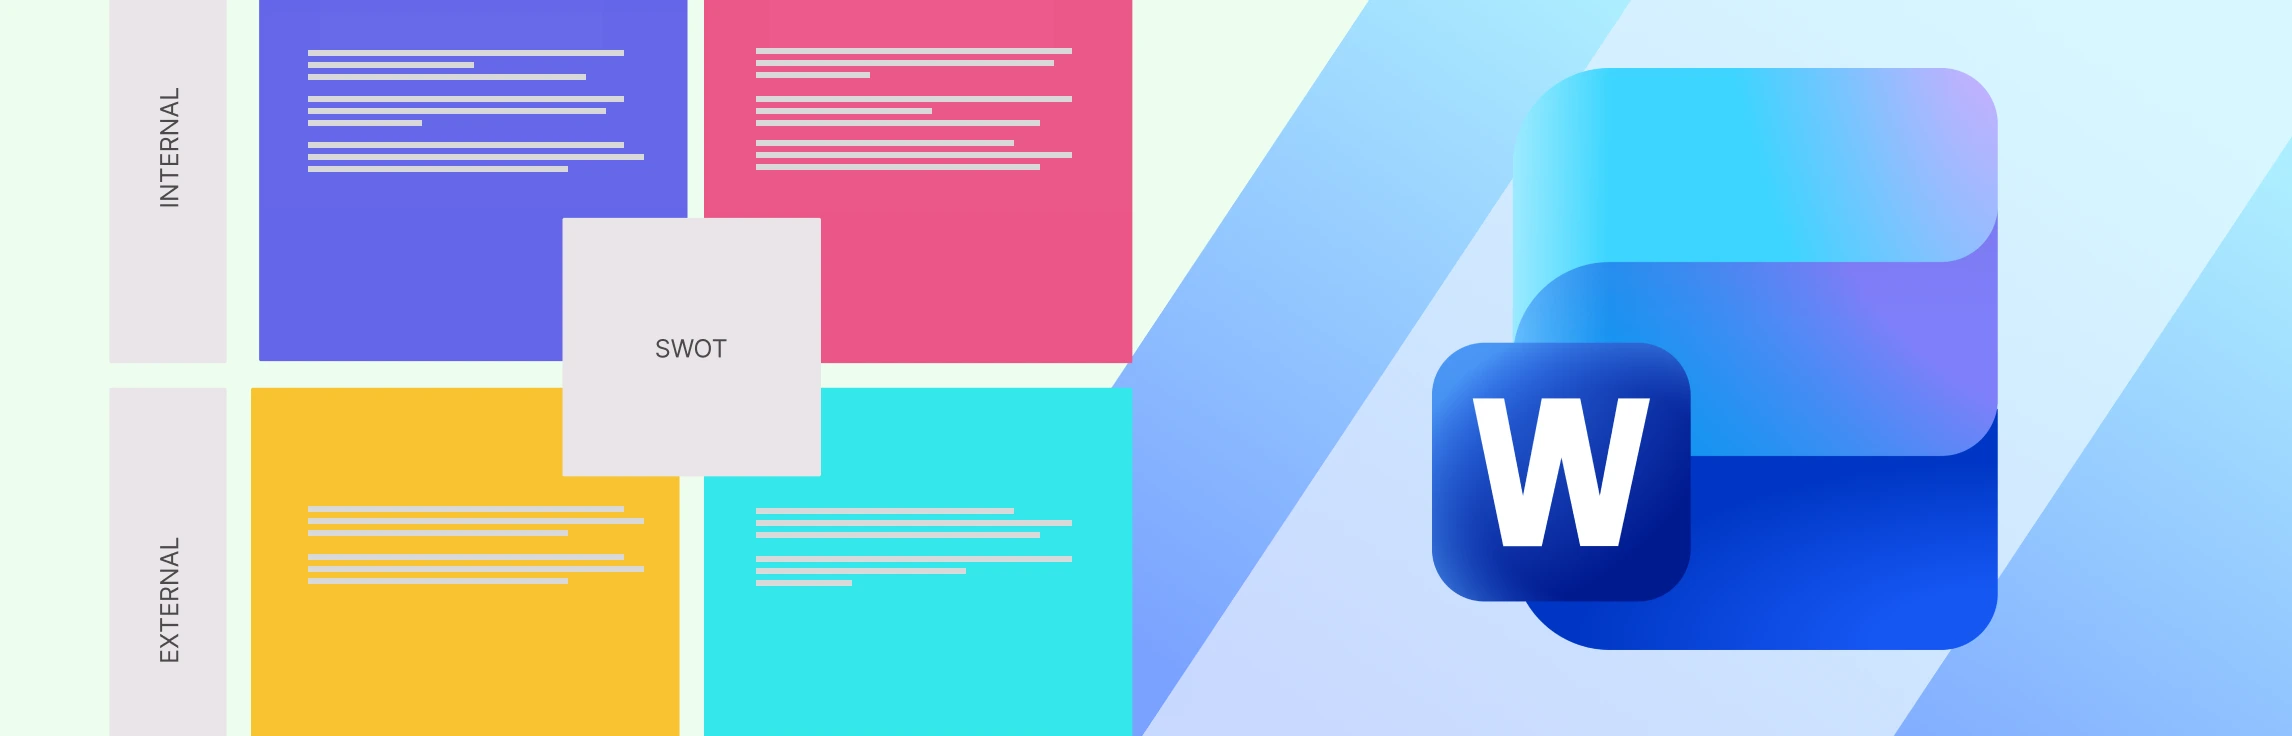
If you’ve ever tried creating a SWOT analysis in Word, you’ve probably felt the friction from tables that won’t align, to layouts that break as you edit, and versions that quickly get out of sync. In this guide, you’ll learn detailed steps of how to create a SWOT analysis in Word, and where Word starts to fall short for strategic work. We’ll also explore better alternatives when you need more flexibility and collaboration, along with free SWOT templates to help you move faster and plan with confidence.
Creating a clear, professional SWOT analysis in PowerPoint can feel simple at first, until layouts start shifting, text boxes misalign, and your slide becomes hard to read. This guide walks you through everything you need to know, from building a SWOT diagram step by step to understanding the common challenges that come with PowerPoint’s manual formatting. After you’ve mastered how to present a SWOT analysis in PowerPoint, we’ll explore a better alternative and free templates that make the process faster, cleaner, and more presentation-ready.
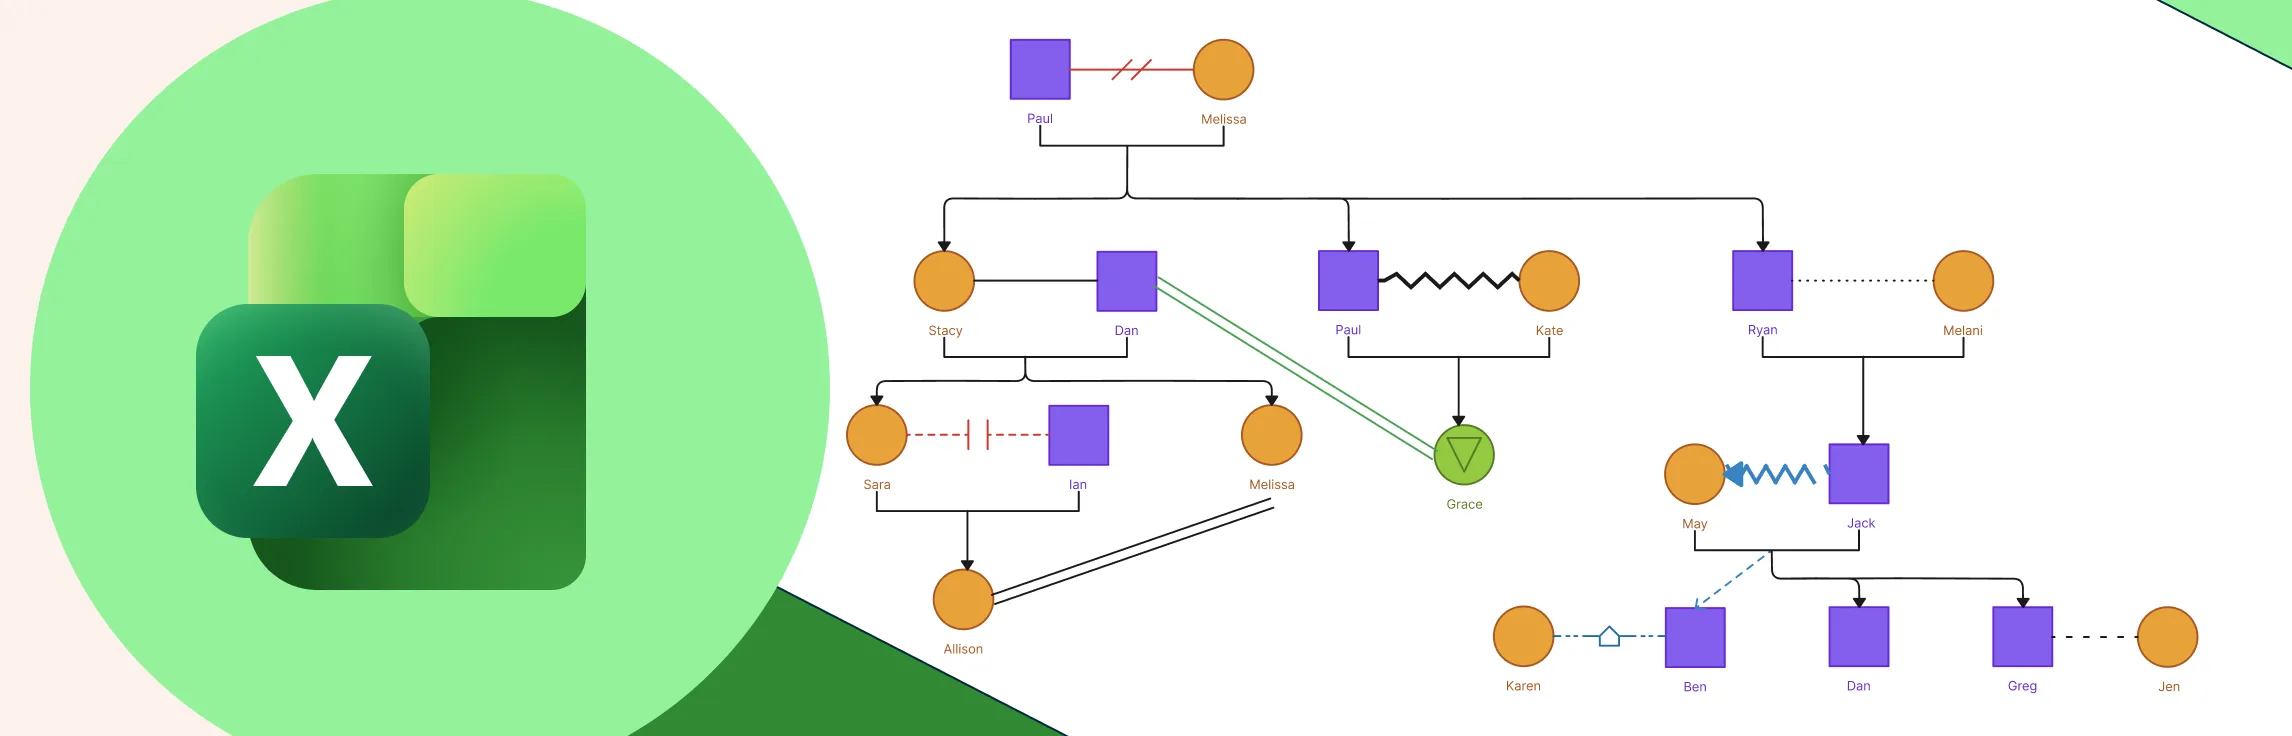
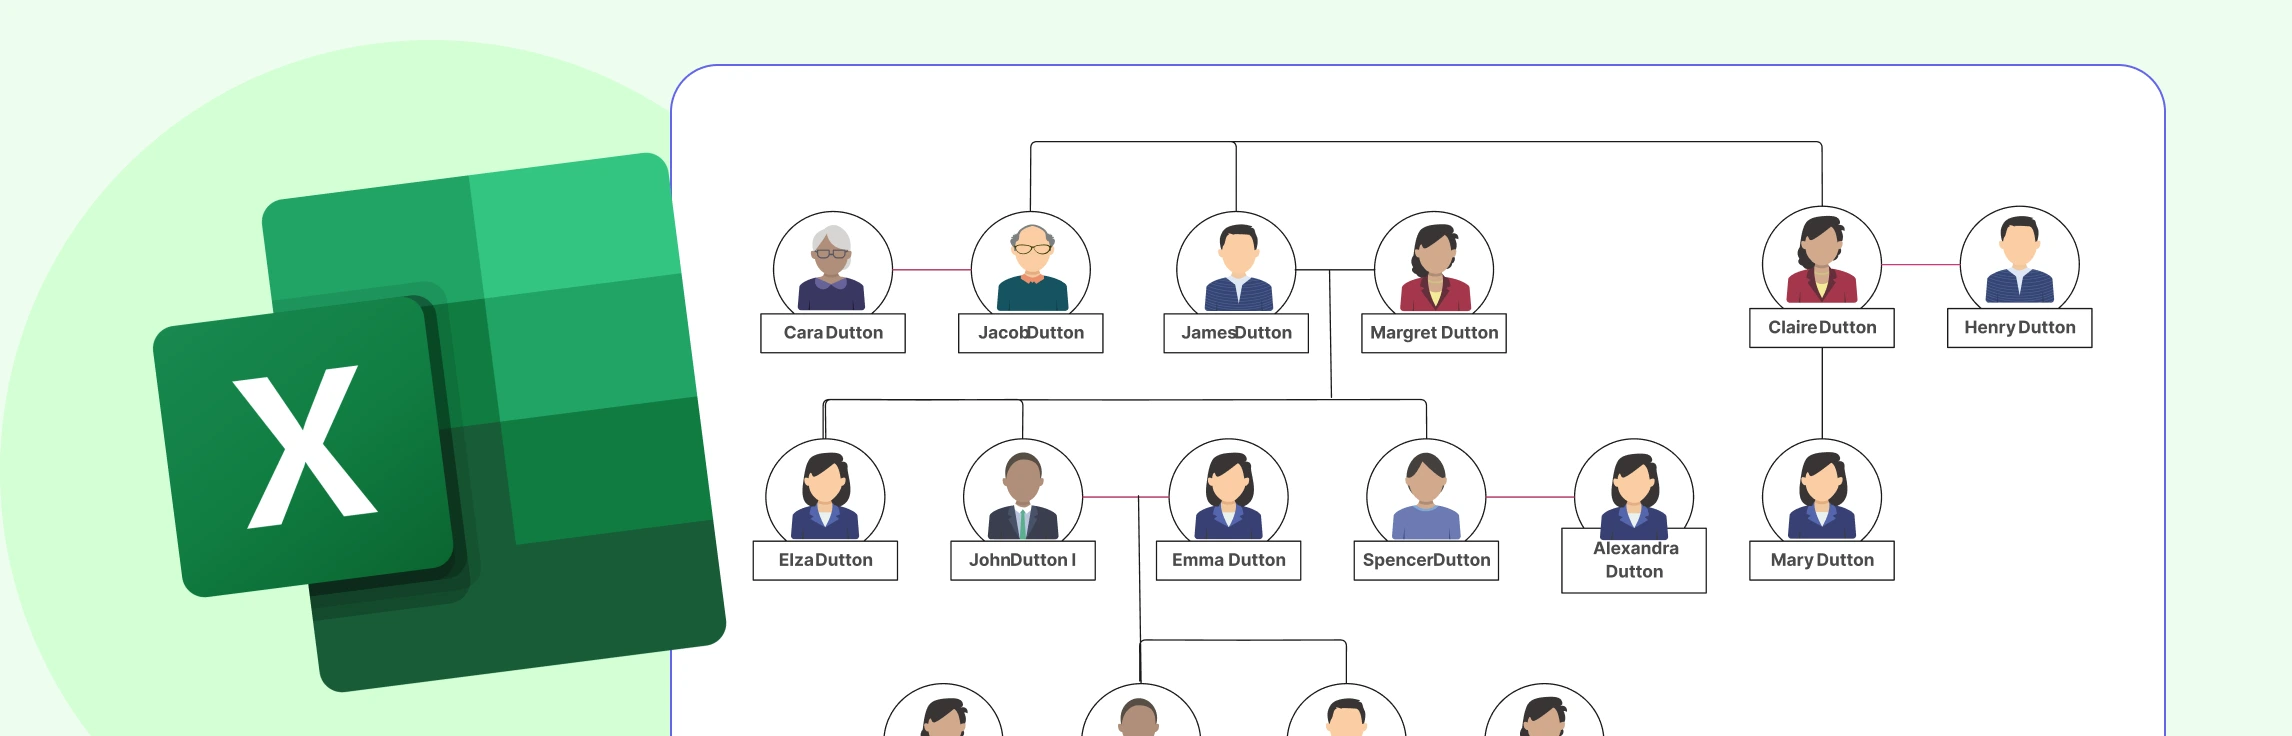
Working with shapes, connectors, and layouts inside a spreadsheet can take extra time and care, especially as your genogram becomes more detailed. This guide walks you through the essentials of how to make a genogram in Excel so you can do it confidently, while also helping you understand when a more specialized diagramming tool might offer a smoother, more efficient experience.
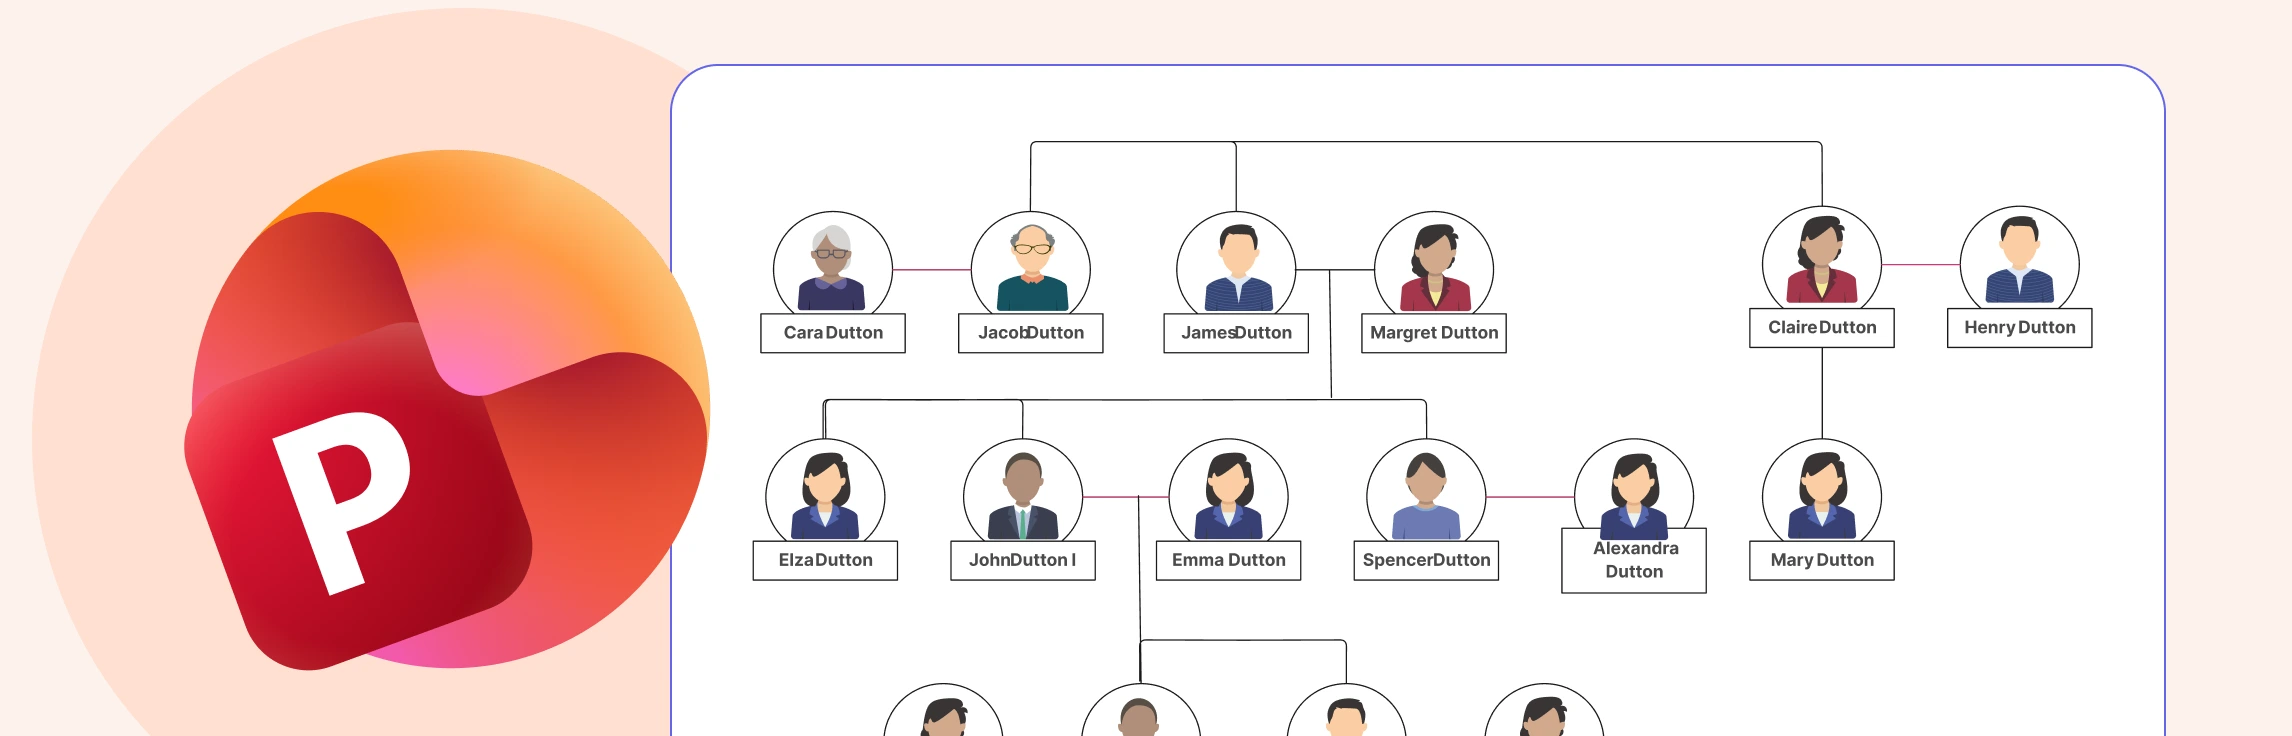
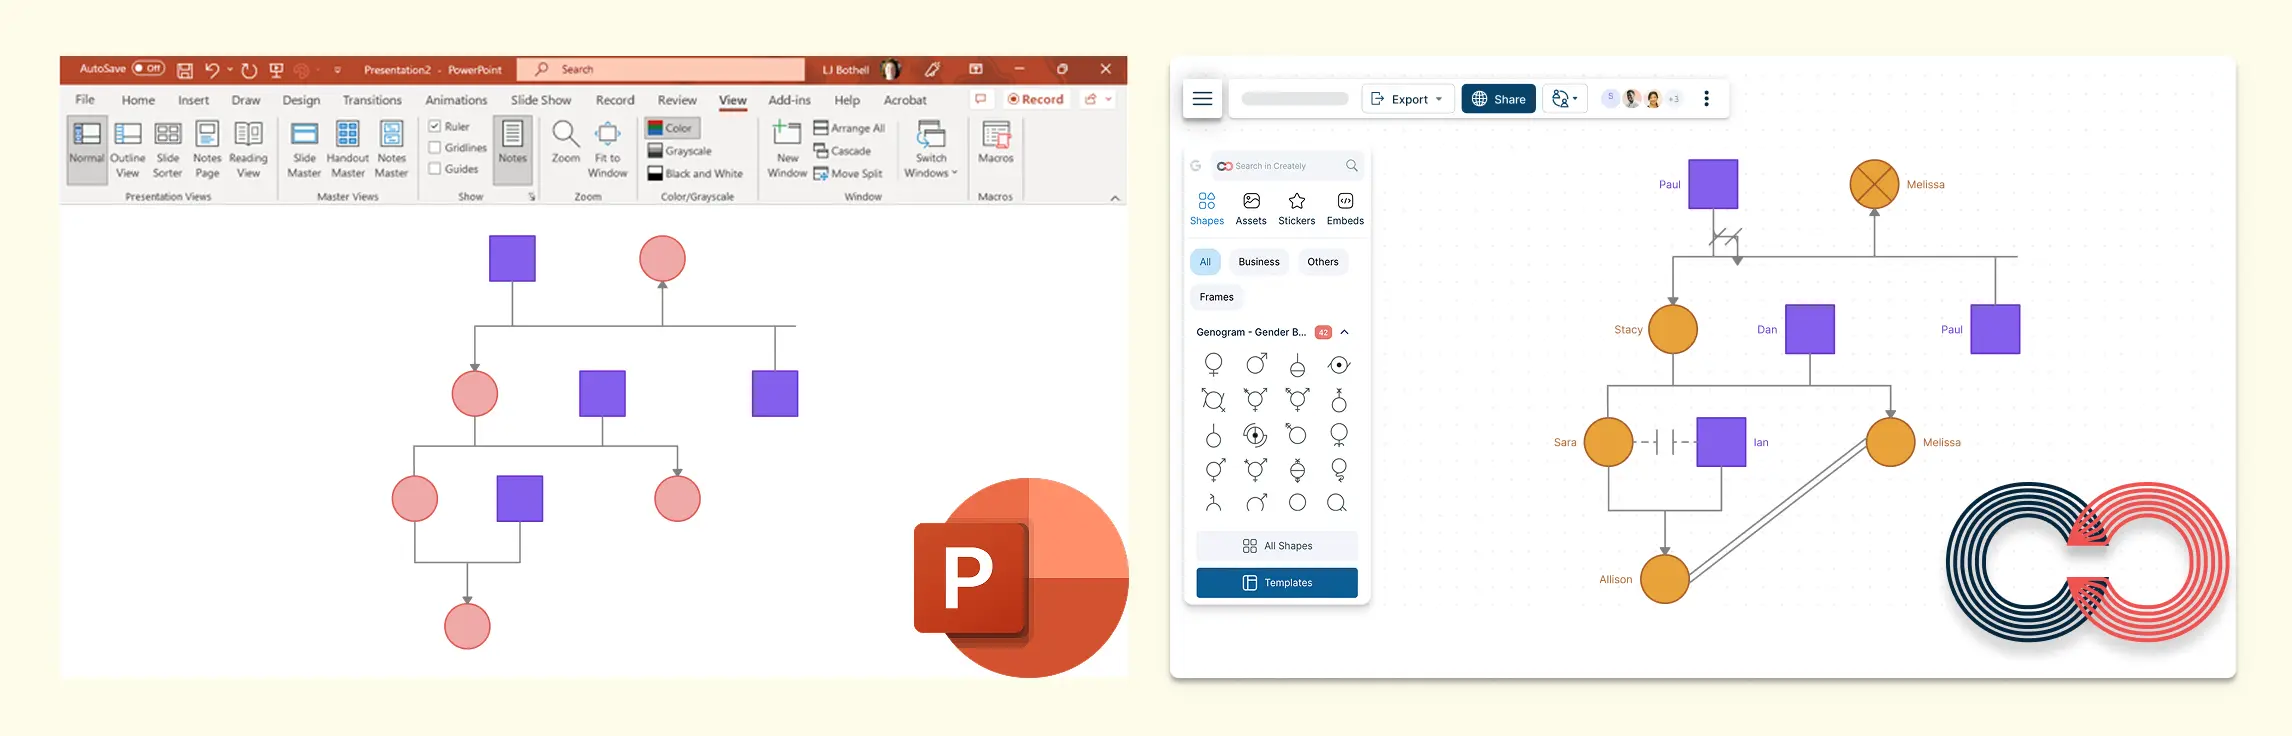
If you’re exploring how to make a family tree in PowerPoint, you’re likely looking for a straightforward way to map out your family history using software you already have access to. PowerPoint can create simple, structured diagrams, but it does require manual setup and adjustments as your tree grows. In this guide, you’ll learn the step-by-step process, understand the limitations you may run into, discover an alternative option and free templates that can help you build a clear, organized family tree with less effort.
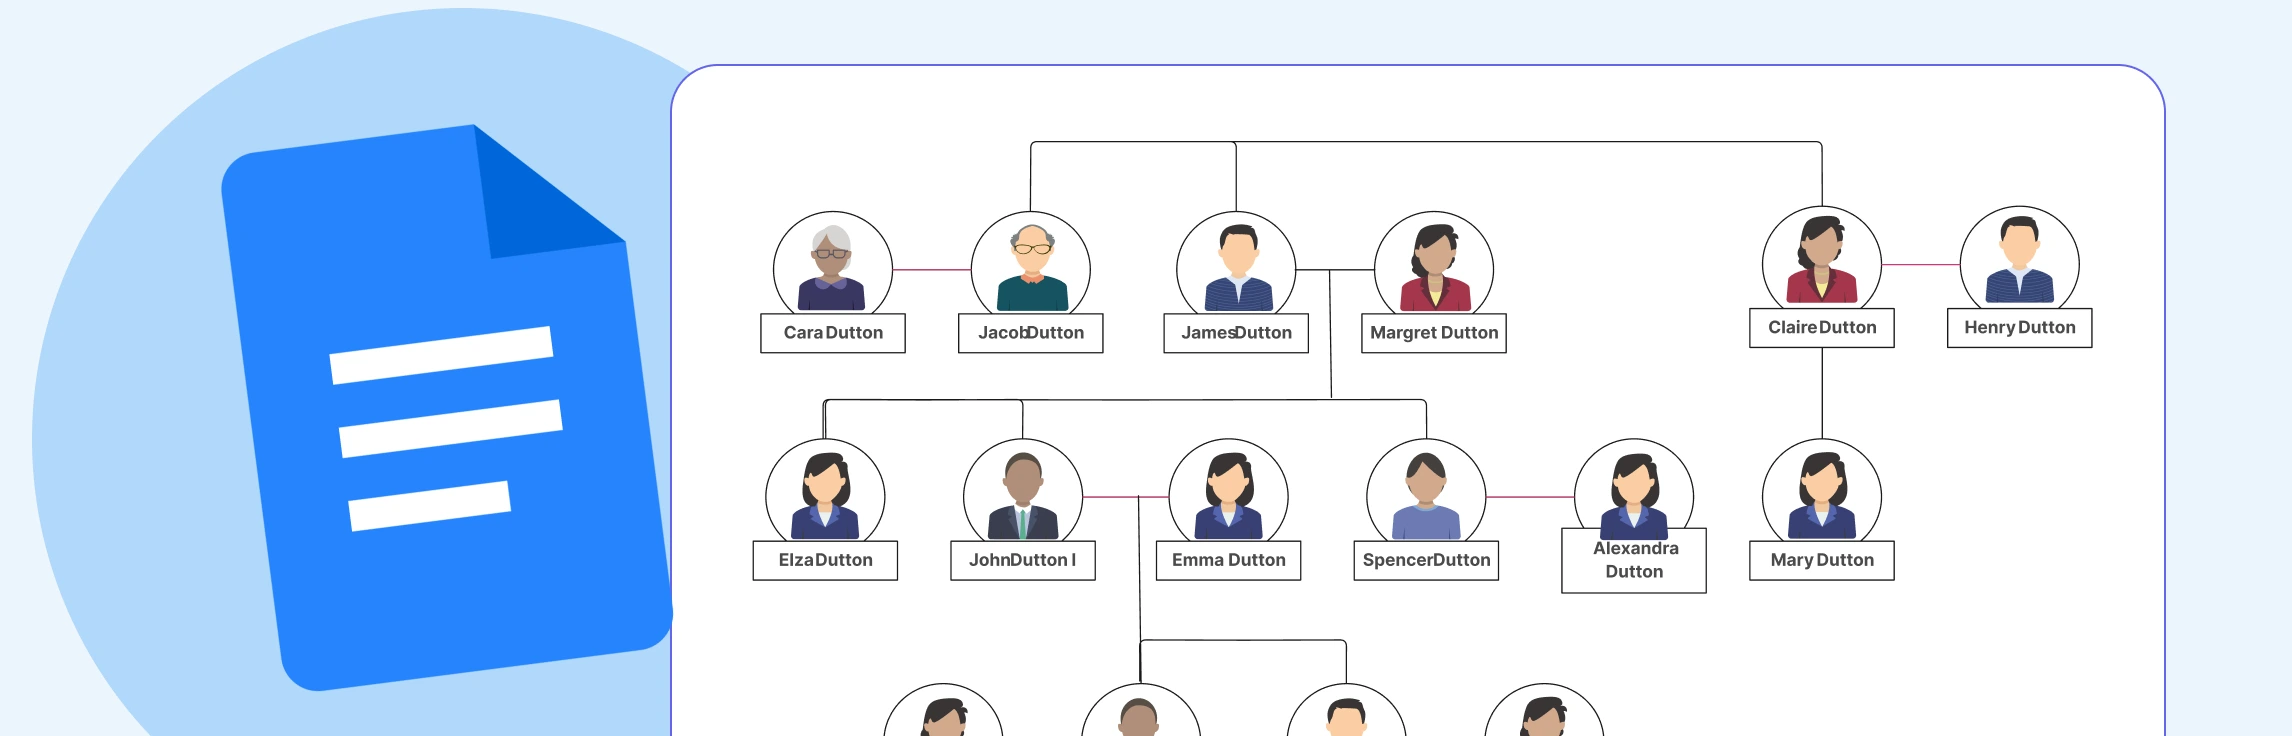
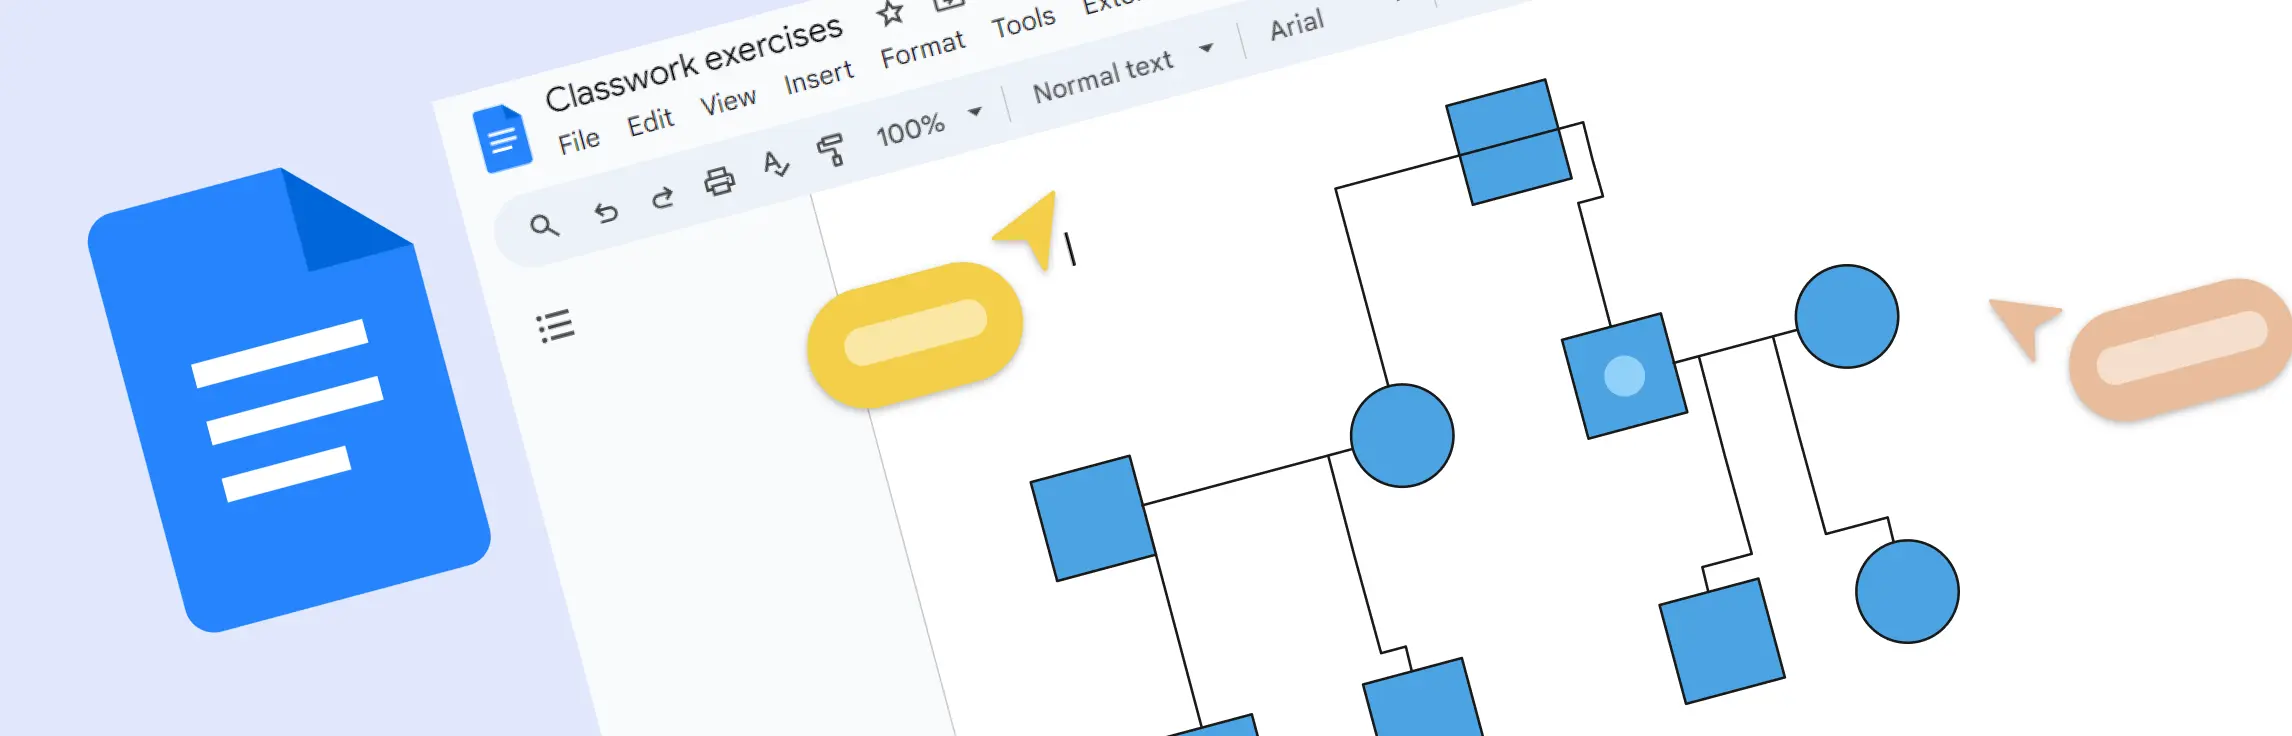
If you’re trying to figure out how to make a family tree in Google Docs, you’re likely looking for a simple way to map out family relationships using tools you already have. Google Docs can create basic diagrams, but it does require some manual work to structure generations and keep everything aligned. This guide walks you through the steps, explains the limitations you may run into as your tree expands, and offers alternative options and free templates if you need something more flexible.
Whether you’re mapping out your ancestry for a school project, organizing family history for elders, or simply curious about how everyone is connected, you’ll need to understand how to build a basic family tree. In this guide, you’ll learn how to do a family tree in Excel using SmartArt or simple shapes, where Excel may fall short as your tree expands, and an easier alternative you can try instead. You’ll also get free templates so you can jump in without starting from scratch.
Starting a family tree drawing can feel overwhelming—messy notes, missing names, and multiple scattered versions can make it hard to see the bigger picture. That’s where a family tree poster comes in: it organizes your family’s history in a clear, visual way, connecting generations and preserving heritage for years to come. In this guide, we’ll show you exactly how to make a family tree poster step by step, with practical tips, inspiring poster ideas, and ready-to-use Creately templates to help you create a beautiful, shareable family tree without the stress.
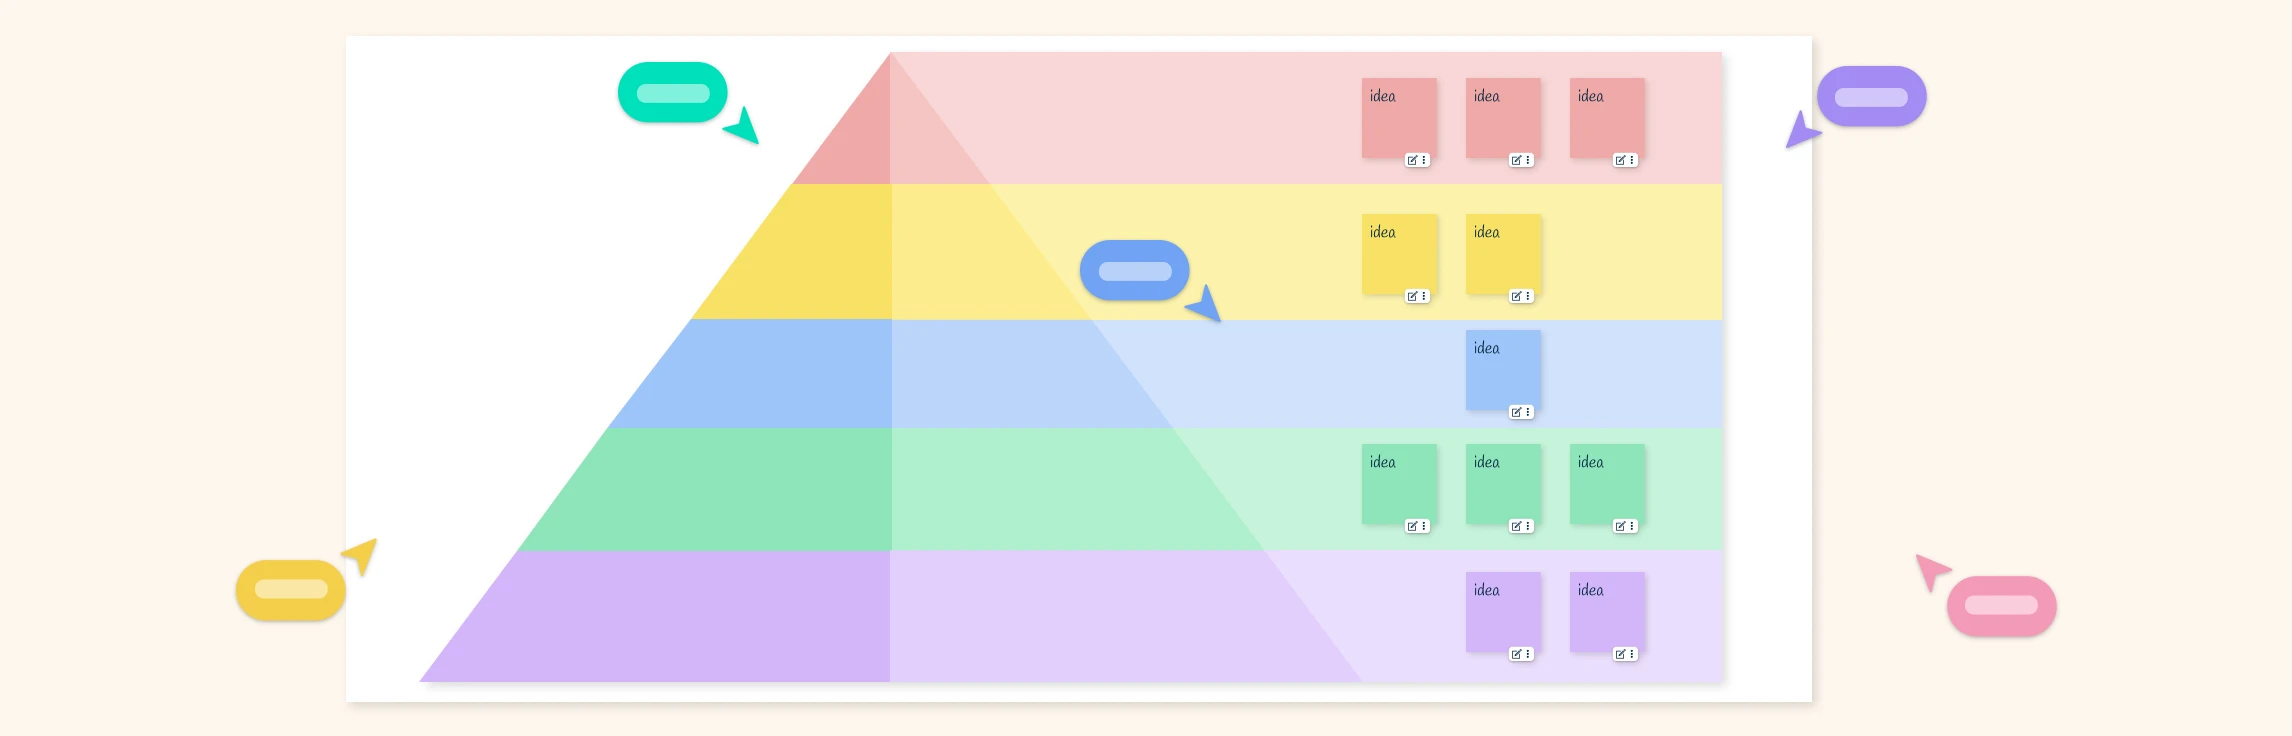
Understanding how people grow, stay motivated, and make decisions becomes much easier when you can see it clearly. This guide walks you through Maslow’s Hierarchy of Needs in a simple way—breaking down each core level and helping you turn it into a clean, visual diagram. You’ll learn the basics, follow a step-by-step process to map the hierarchy, and pick up practical tips to make your diagram clear, useful, and easy for anyone to understand. By the end, you’ll be able to apply this framework to your own field or scenario and create a diagram that fits your specific goals or context.
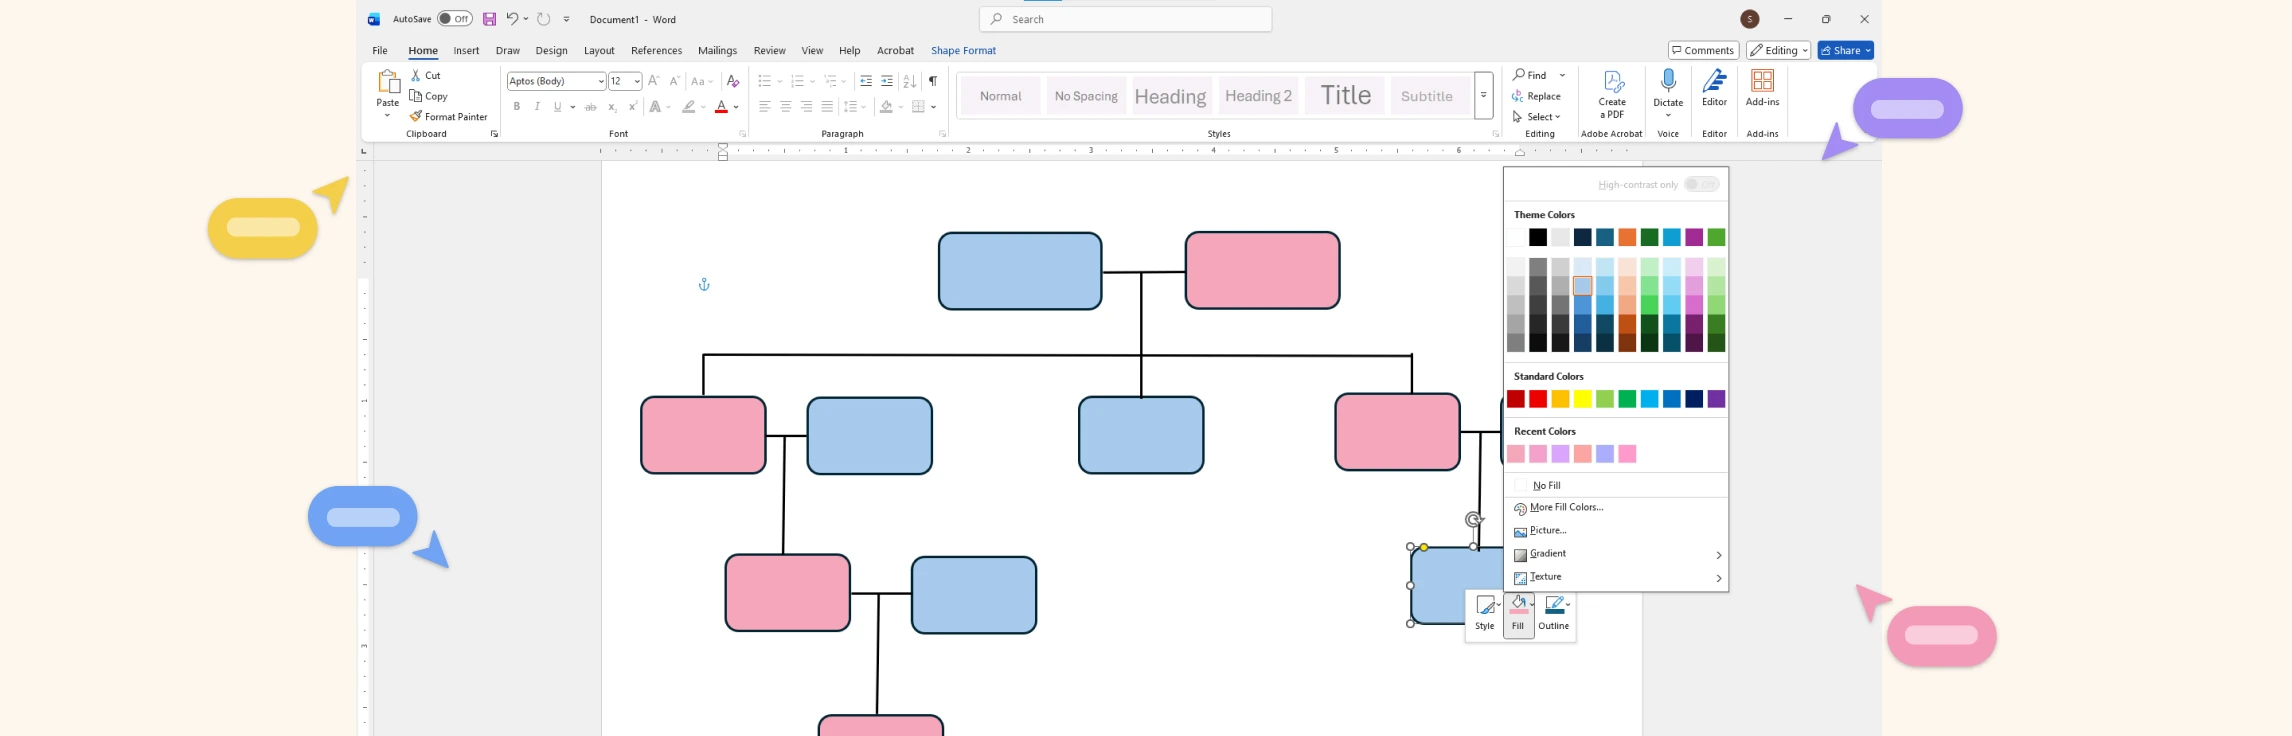
If you’re trying to figure out how to draw a family tree on Word, this guide will walk you through it in a simple, beginner-friendly way. Microsoft Word works well for small, simple family trees—but it quickly becomes limiting as your family grows or relationships become more complex. Keep reading to learn the steps of how to build a family tree in Word, then understand what Word can and can’t do, and finally, discover a much easier alternative for creating clearer, more flexible family trees. We’ll also compare this alternative with Microsoft Word and share ready-to-use templates so you can start building your family tree right away.
Therapists often struggle with scattered notes, fragmented stories, and the challenge of making sense of complex family dynamics. Narrative family therapy offers a structured, empowering approach that helps families reframe their stories, uncover patterns, and build stronger connections. By combining this approach with visual tools like genograms and eco-maps, therapy sessions become clearer, faster, and far more actionable, turning abstract problems into insights that families can see, understand, and act on.
Juggling scattered notes, multiple therapy models, and complex family dynamics can be frustrating. Integrative family therapy streamlines this process by combining approaches like CBT, narrative, and attachment-focused methods. With visual tools such as genograms, family maps, and timelines, therapists can quickly uncover patterns, track progress, and deliver personalized care, bringing clarity, speed, and insight to every session.
Therapy sessions can quickly become overwhelming when notes are scattered, family patterns are hard to decode, and critical context is missing. That’s where genograms in therapy come in. These visual maps go beyond traditional family trees, revealing relationships, emotional dynamics, and intergenerational patterns in a way that’s fast, intuitive, and actionable. In this guide, we’ll explore what genograms are, why they’re so useful, the key elements that make them effective, practical ways to use them in therapy sessions, and how tools like Creately simplify the process, helping therapists and clients gain clarity, insight, and meaningful breakthroughs.
Family therapy can be messy. Multigenerational patterns, hidden loyalties, unspoken debts, and conflicting expectations often leave both clients and therapists feeling overwhelmed. That’s where contextual family therapy shines, it provides a structured, ethically grounded approach to understanding fairness, trust, and accountability across generations. In this guide, we’ll explore the core concepts, dimensions, and practical techniques of contextual family therapy, while showing how visual tools like genograms and family trees can help therapists map complex relationships, reduce overwhelm, and bring clarity to even the most complicated family systems.
Ever tried tracing your family history only to end up with a tangle of names, dates, and scattered notes that make your head spin? That’s where family tree software comes in, transforming a chaotic jumble of facts into a clear, organized, and interactive family tree that’s easy to explore and share.
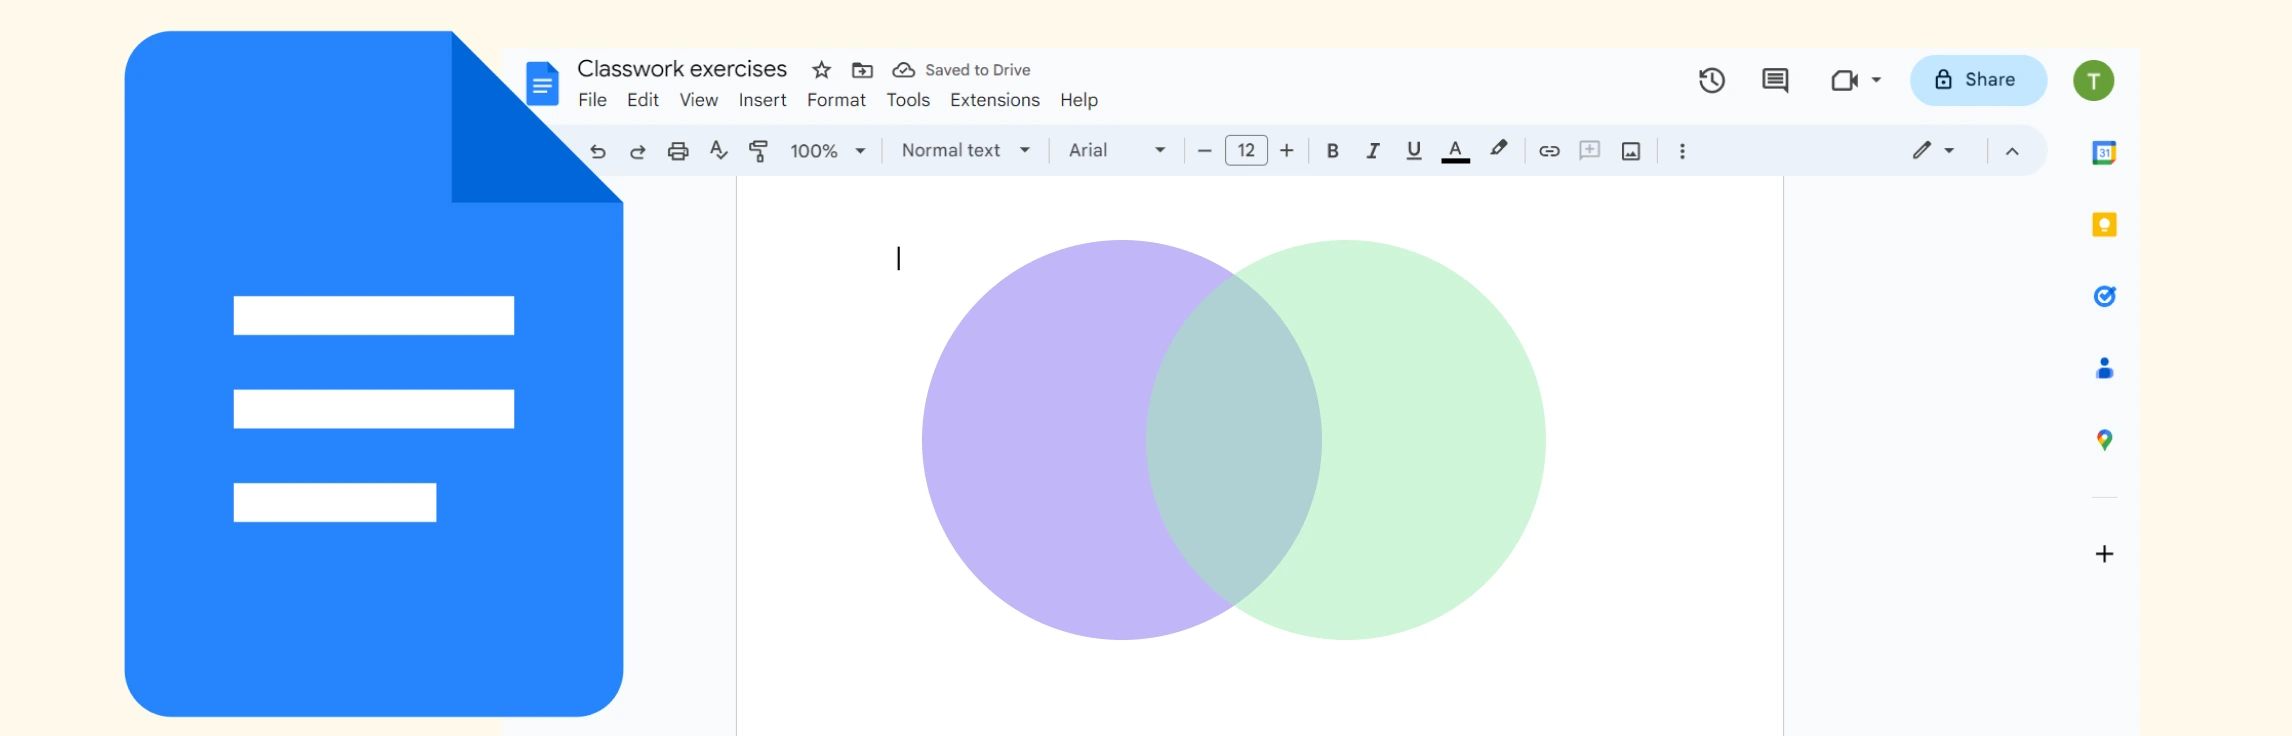
If you want to know how to do a Venn diagram in Google Docs, then this guide is for you. Discover what Venn diagrams are, how to create one in Google Docs, and understand the limitations of Google Docs for making them. We also dive into a better alternative, and compare the two methods.
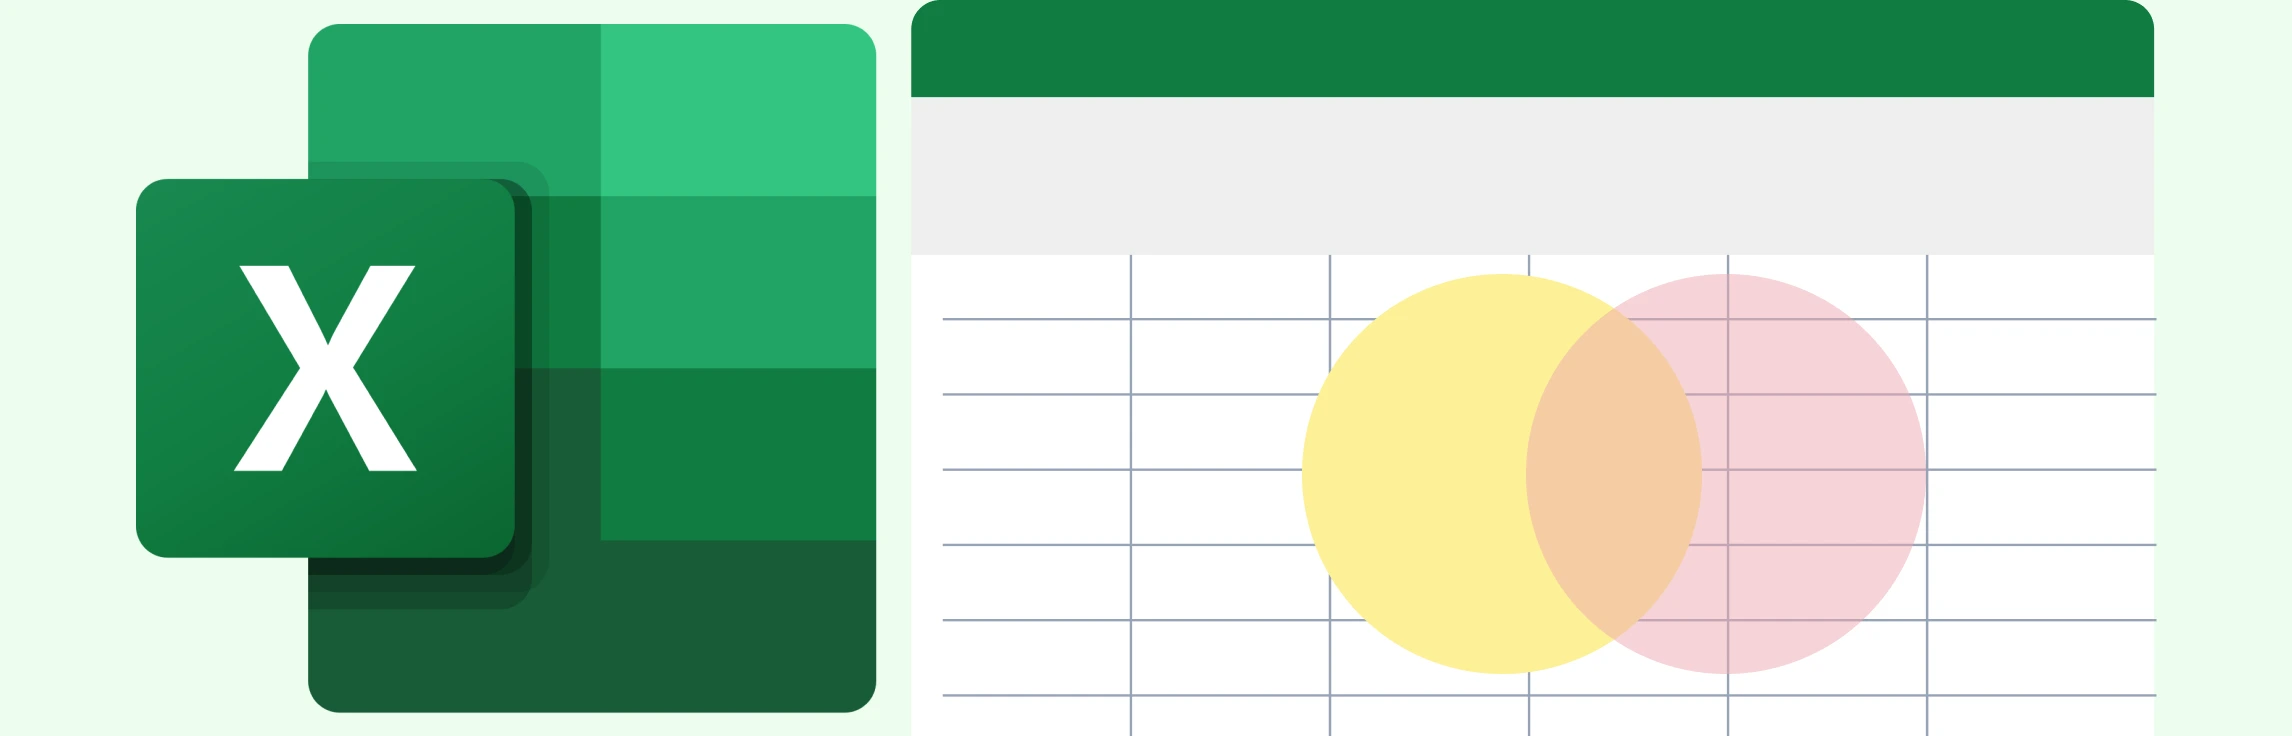
If you’re wondering how to create a Venn diagram in Excel, then you’ve come to the right place. We explore what Venn diagrams are, how to make a Venn diagram in Excel, and understand the challenges of using Excel for this. This guide also covers an easier to use and better alternative which comes with plenty of ready-made templates for making Venn diagrams.
When you’re working with complex family histories, scattered case notes and long, tangled stories can make it nearly impossible to see the bigger picture. Therapists often feel the frustration firsthand, trying to track emotional legacies, repeating roles, and intergenerational trauma without a clear visual map. Transgenerational Therapy offers a powerful way to understand how patterns move across generations, and when paired with tools like genograms, the work becomes even clearer and more actionable. This guide walks you through the core concepts, models, and patterns behind this approach, plus how modern tools make it easier to support your clients with clarity and confidence.
Therapists and students often feel overwhelmed by scattered case notes and complex family dynamics, making it hard to plan effective interventions quickly. This guide breaks down Strategic vs Structural Family Therapy in a clear, approachable way, helping you understand the purpose, techniques, and differences between the two models. You’ll also discover how visual mapping tools like genograms and family tree diagrams can simplify session prep, reveal patterns at a glance, and make your workflow faster and more organized. With Creately’s intuitive templates, creating these visual maps becomes effortless, so you can focus on what truly matters: guiding families toward healthier, functional relationships.
If you’ve ever felt overwhelmed by scattered notes, complex family stories, or the challenge of tracking relationships in therapy, you’re not alone. Many therapists, social workers, and educators struggle to make sense of intricate family dynamics without a clear visual approach. Functional Family Therapy helps improve communication, address behavioral challenges, and strengthen family dynamics, but even proven techniques are easier to apply with a clear visual approach. Genograms and family trees turn scattered notes into actionable insights, saving time, reducing frustration, and helping families build stronger, healthier connections.
Working with families can be rewarding, but it often comes with frustrations. Scattered notes, complex family histories, and hard-to-track patterns can make therapy feel overwhelming. That’s where family therapy models come in. They provide structured approaches to understanding relationships, resolving conflicts, and promoting healthier dynamics.
If you’ve been wondering how to draw a Venn diagram in Word, then this guide is for you. Keep reading to discover what a Venn diagram is, step-by-step instructions on how to add a Venn diagram in Word, and understand its limitations. This also covers a better alternative and a comparison between the two methods.
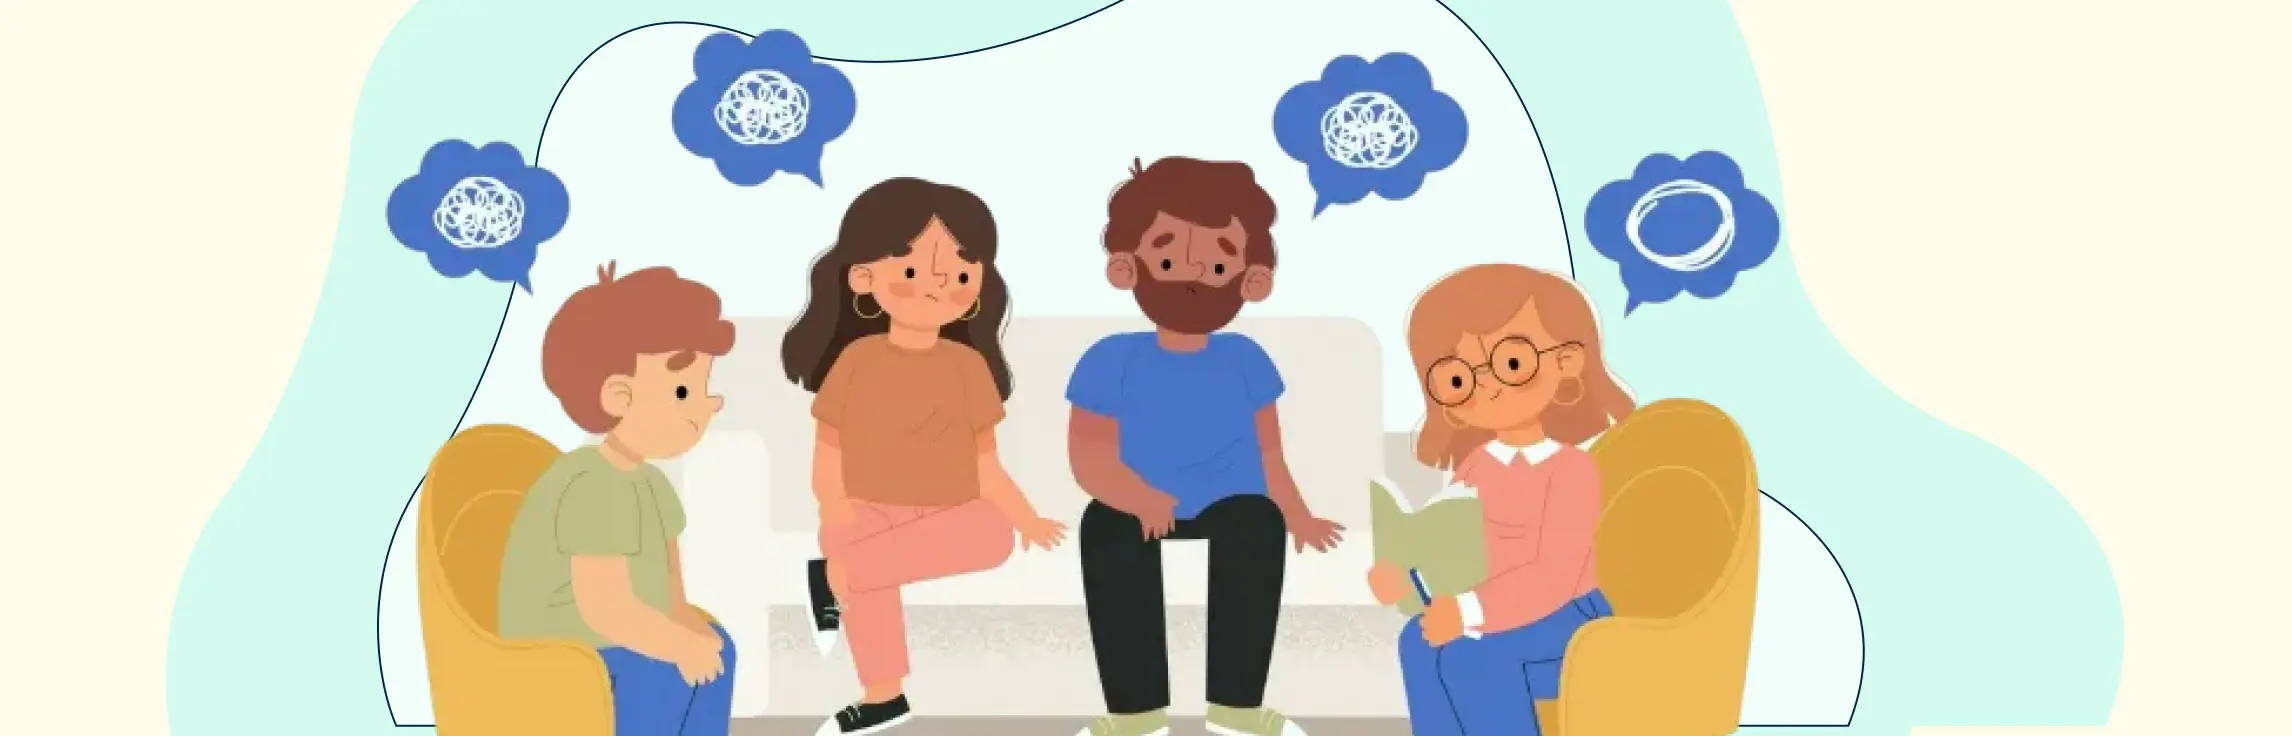
Ever feel like your family keeps hitting the same communication roadblocks, no matter how many meetings or discussions you have? You’re not alone. Whether it’s repeated misunderstandings at home or scattered workflows at work, it can be frustrating when patterns keep repeating and clarity feels out of reach.
Ever feel overwhelmed trying to make sense of a client’s family story? Between scattered notes, overlapping relationships, and complex patterns, it can feel like you’re trying to solve a puzzle without all the pieces. That’s where family mapping comes in. A family map turns messy, hard-to-track information into a clear, visual representation of relationships, behaviors, and generational patterns. With family mapping, you can see the connections at a glance, spot recurring issues, and plan your sessions with confidence, without getting lost in paperwork.
Every family has invisible patterns that shape how its members connect, communicate, and resolve conflict. Therapists often uncover these dynamics using visual tools like genograms, which map relationships, boundaries, and emotional patterns across generations. Rooted in structural family therapy, a model developed by Salvador Minuchin, this approach views the family as a living system with distinct structures and subsystems that influence behavior and well-being. By understanding these structures, therapists can identify where boundaries blur, hierarchies break, or roles overlap, leading to stress and dysfunction.
Ever felt like different parts of you are constantly at odds; one side wanting change while another resists it? That inner conflict is something most people experience, and it’s exactly what internal family systems therapy (IFS therapy) seeks to heal. In this quick guide, we’ll explore what the IFS model is, how it works, its key concepts, benefits, and how tools like genograms can enhance therapy sessions for both individuals and mental health professionals.
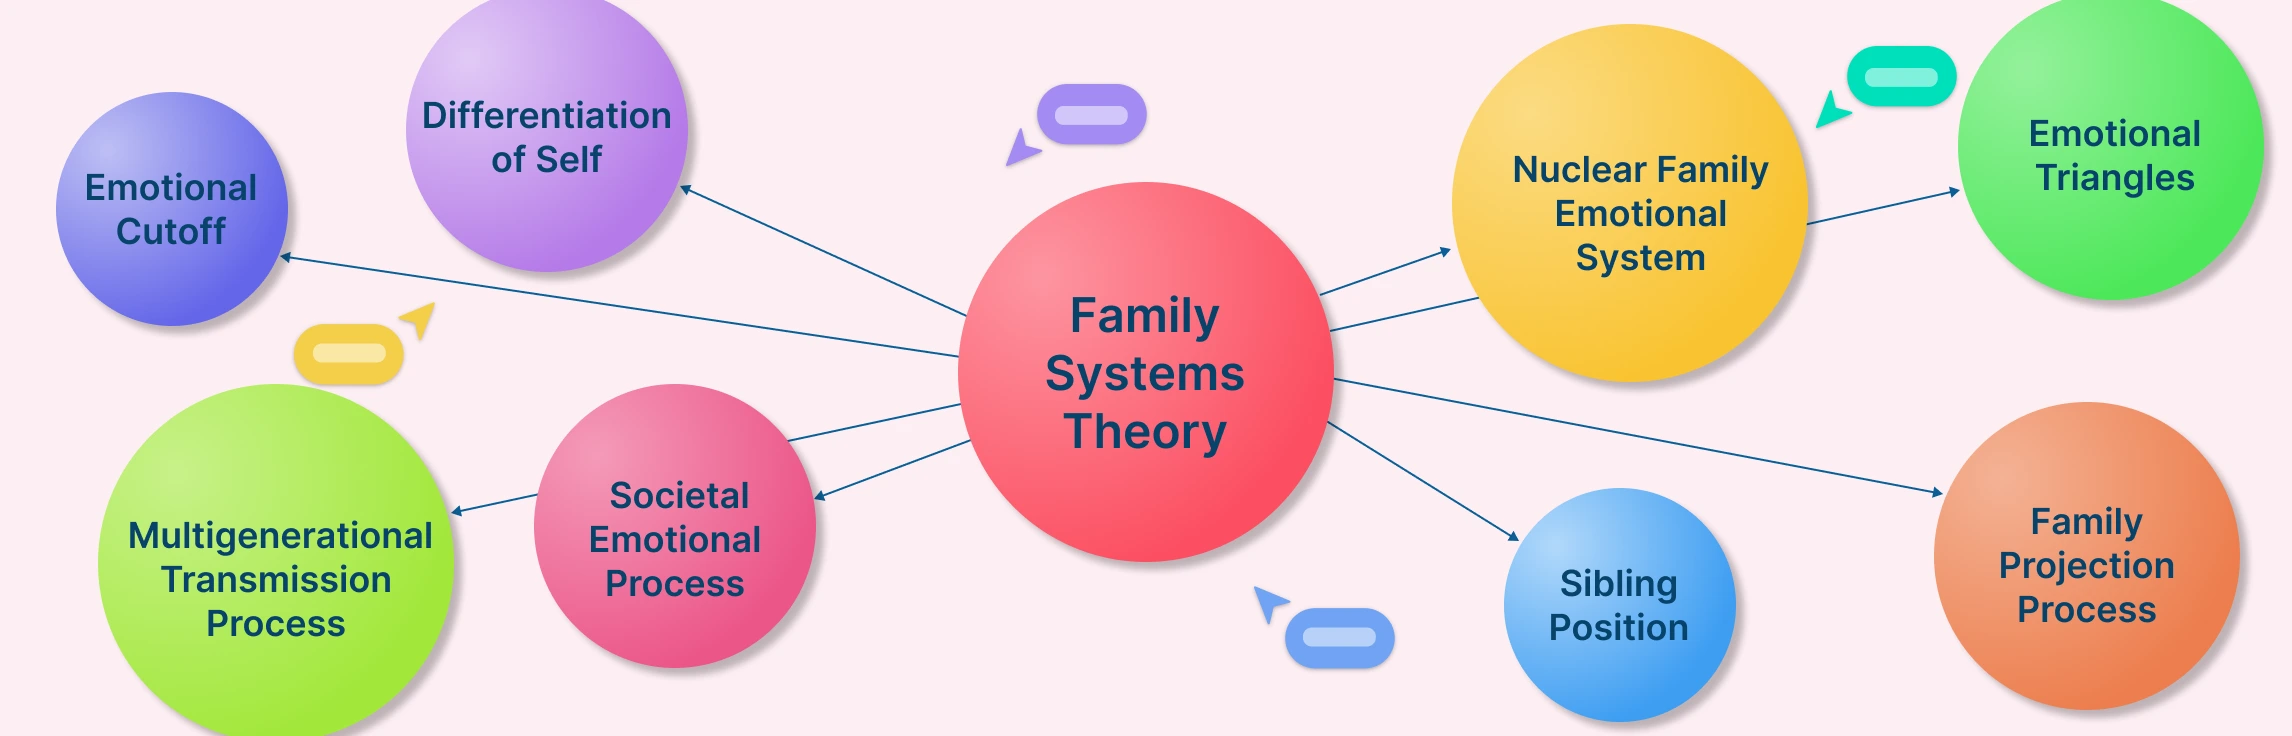
Families are complex systems where every member’s behavior can influence the whole. Yet, trying to understand patterns, roles, and intergenerational dynamics can feel overwhelming, especially without a clear visual tool. Family systems theory offers a framework to make sense of these relationships, and when combined with genograms, it becomes easier to map patterns, roles, and emotional connections across generations.
Trauma can affect individuals, families, and entire communities—shaping relationships, behaviors, and emotional well-being across generations. Understanding how trauma is passed down or shared helps professionals design more effective pathways for healing and recovery. trauma mapping offers a visual way to trace these emotional and psychological patterns, and when combined with genograms, it becomes a powerful tool for identifying connections between experiences, stress responses, and resilience over time.
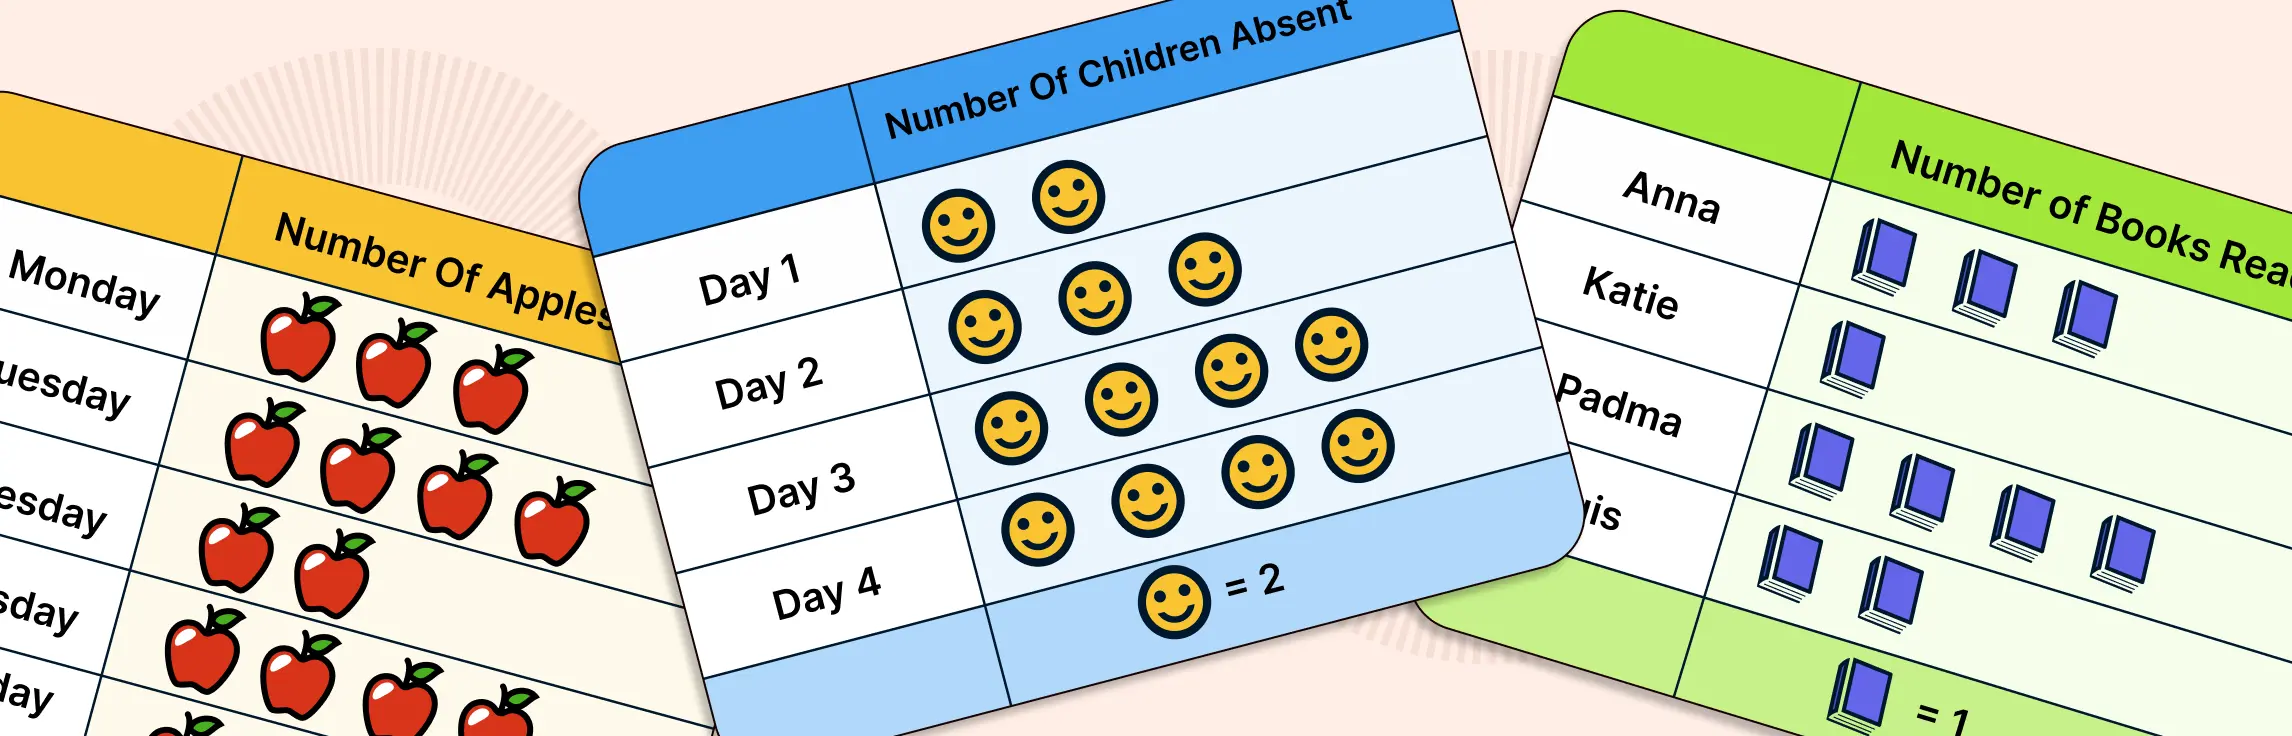
Ever struggled to make numbers or ideas instantly click with your audience? That’s where pictograms come in. Instead of overwhelming people with long tables or text, pictograms use simple icons and visuals to turn information into something clear and memorable. In this guide, you’ll learn how to make a pictograph step by step, explore ready-to-use templates, and discover best practices for creating designs that communicate with impact.
A therapy genogram is a clinical diagnostic tool used to map out family relationships, emotional dynamics, hereditary patterns, and psychosocial factors that influence a patient’s mental and physical health. Unlike a family tree, a genogram integrates clinical data—such as psychiatric history, behavioral patterns, and systemic relational dynamics—to inform assessments and treatment plans.
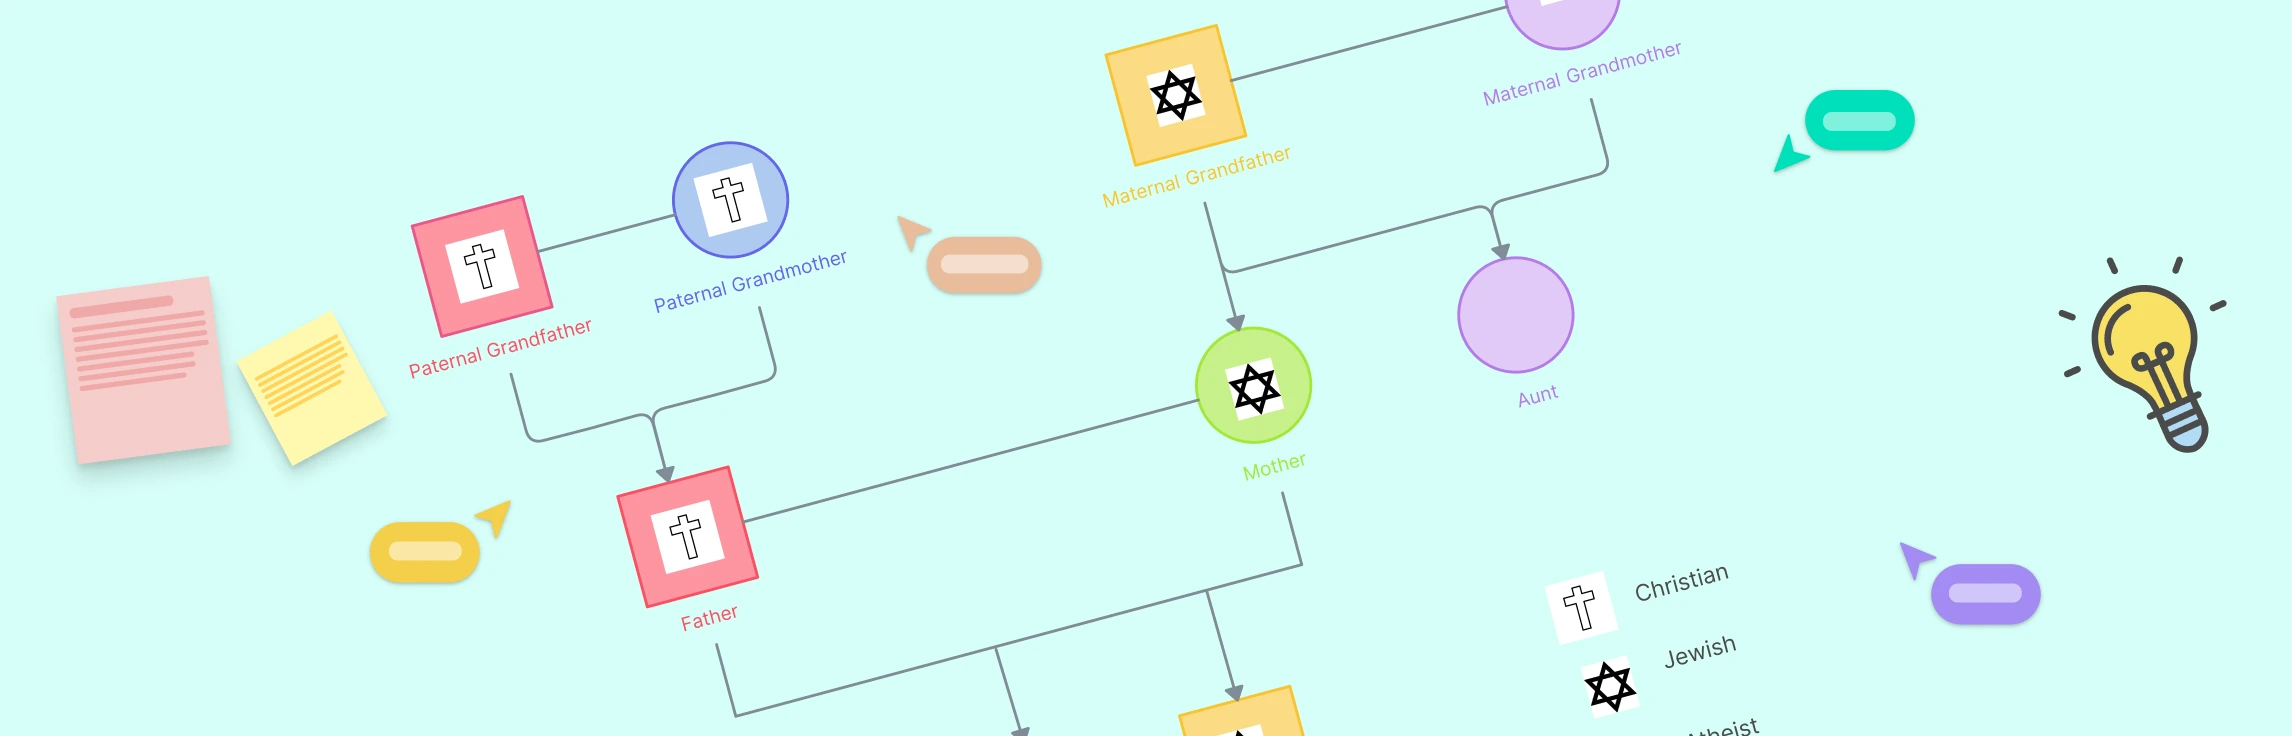
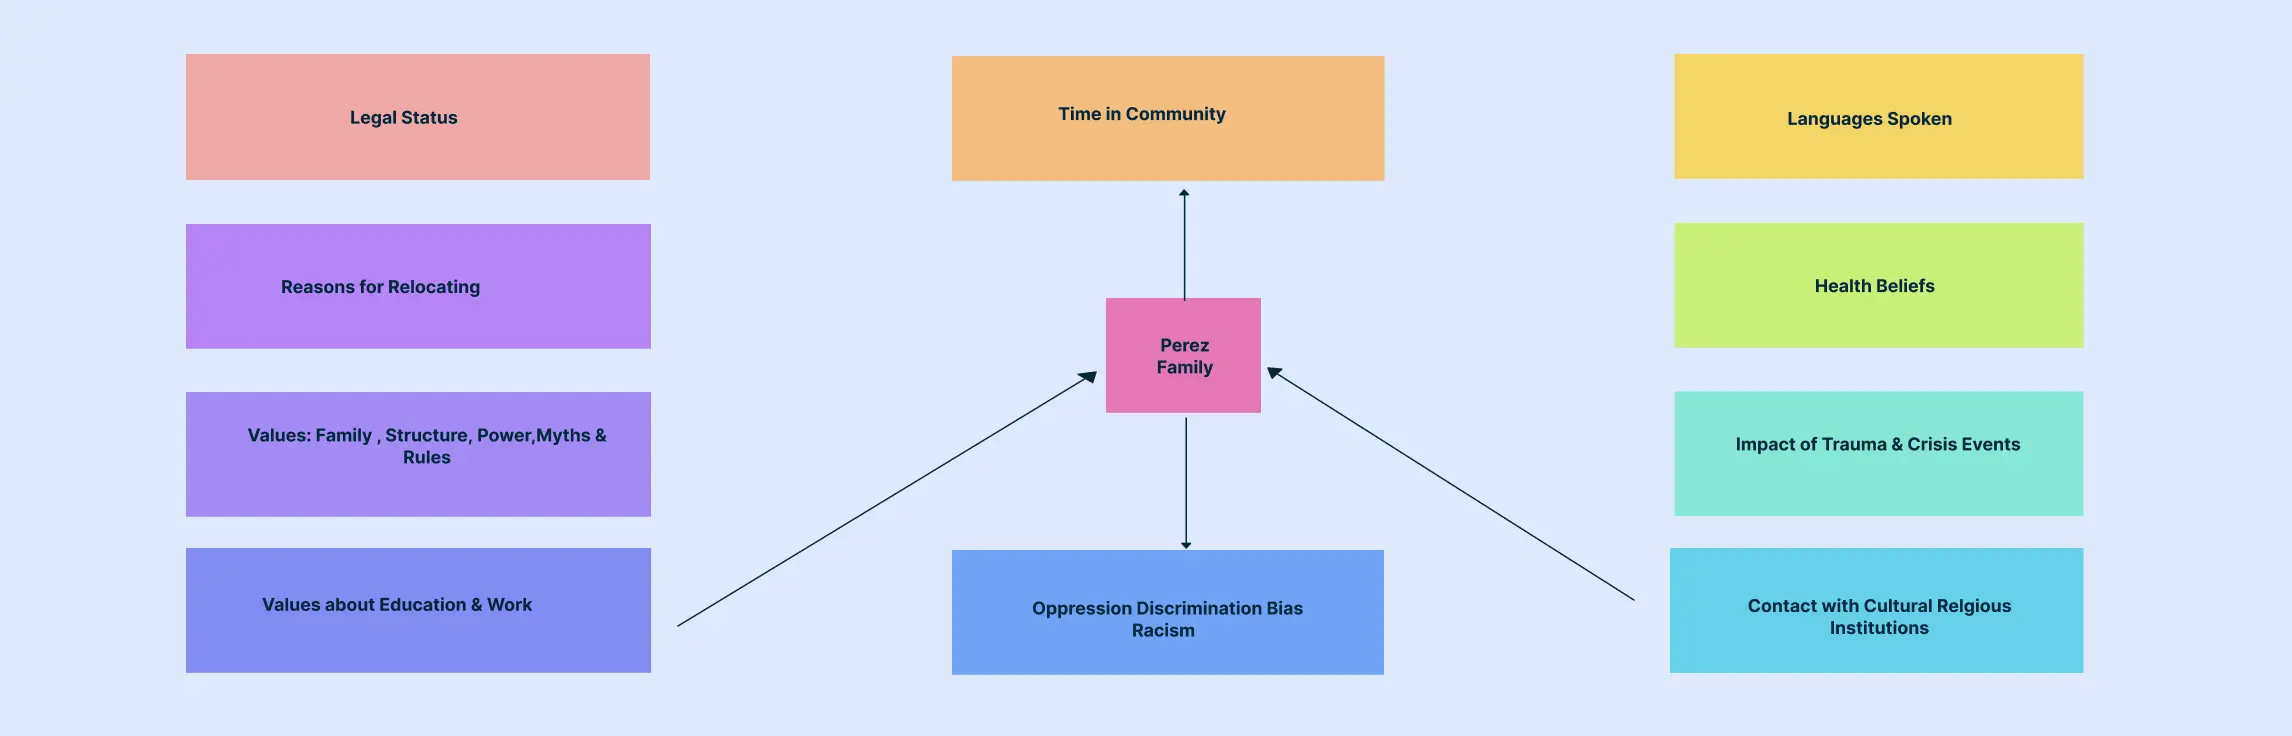
What is a Cultural Genogram? A cultural genogram is a visual family map incorporating heritage, migration routes, and cultural attributes alongside traditional lineage charts. It builds on standard genograms by adding layers for language retention, ceremonies, and customs across generations. Professionals apply cultural genograms in therapy to explore how heritage influences client behavior, in academic research to analyze migration and assimilation patterns, and in organizational diversity mapping to highlight workforce ancestry and tradition.
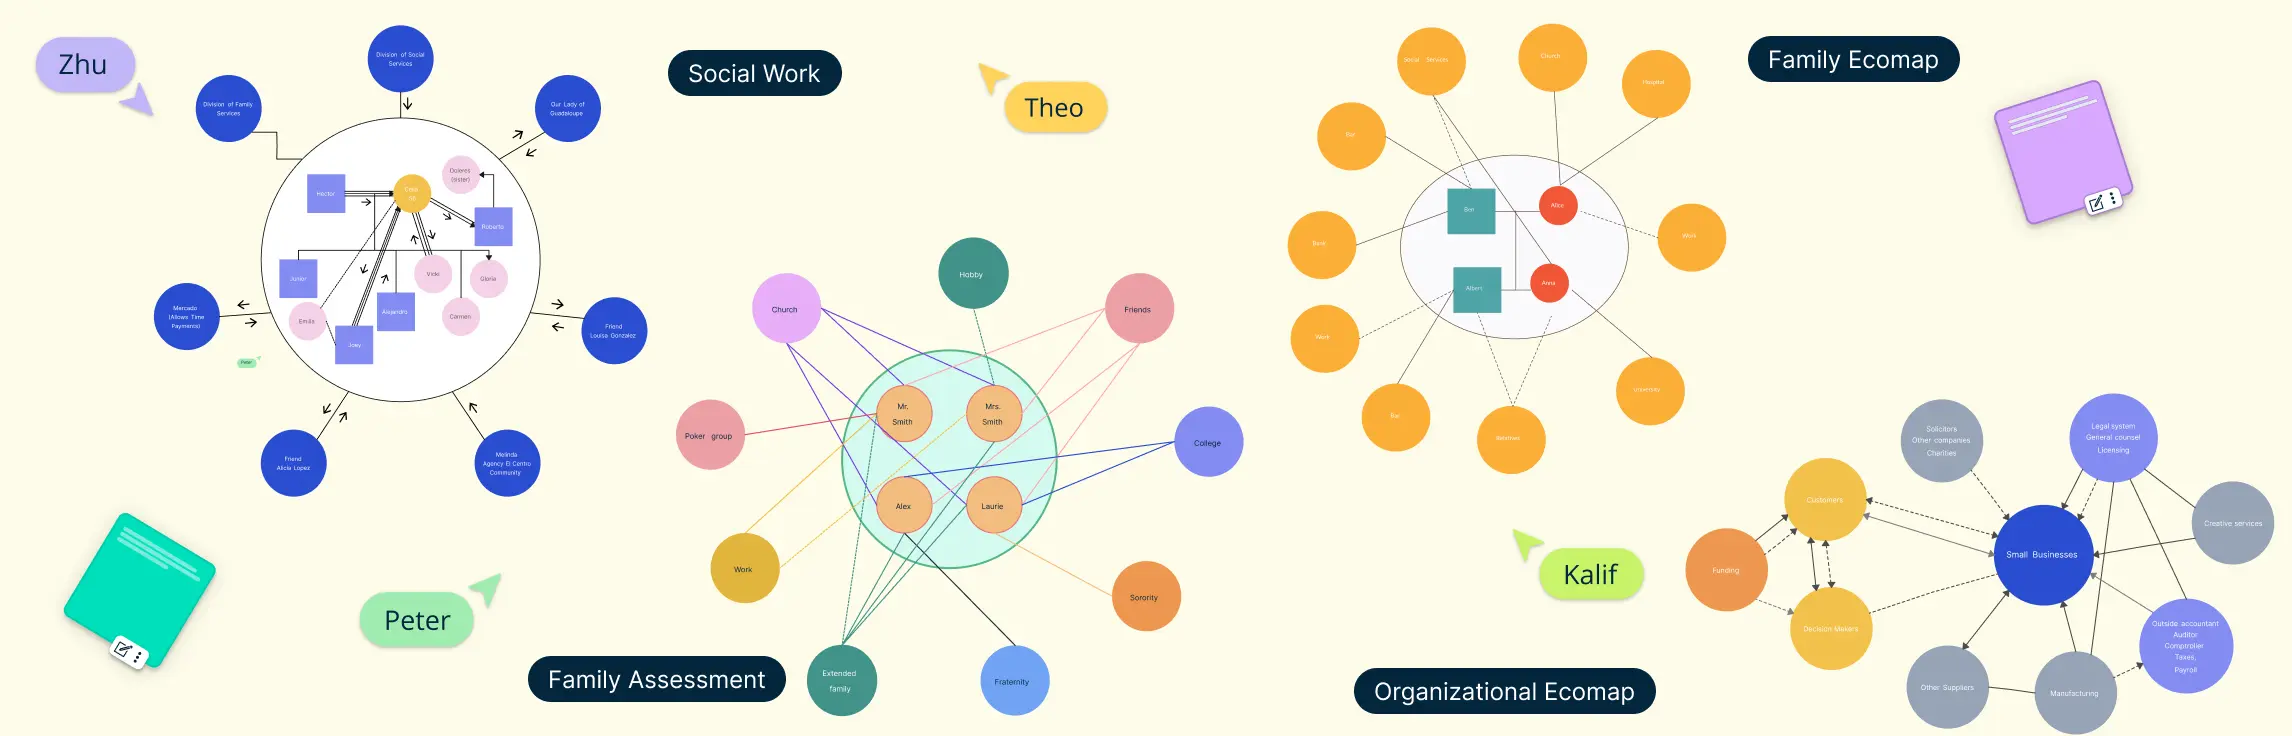
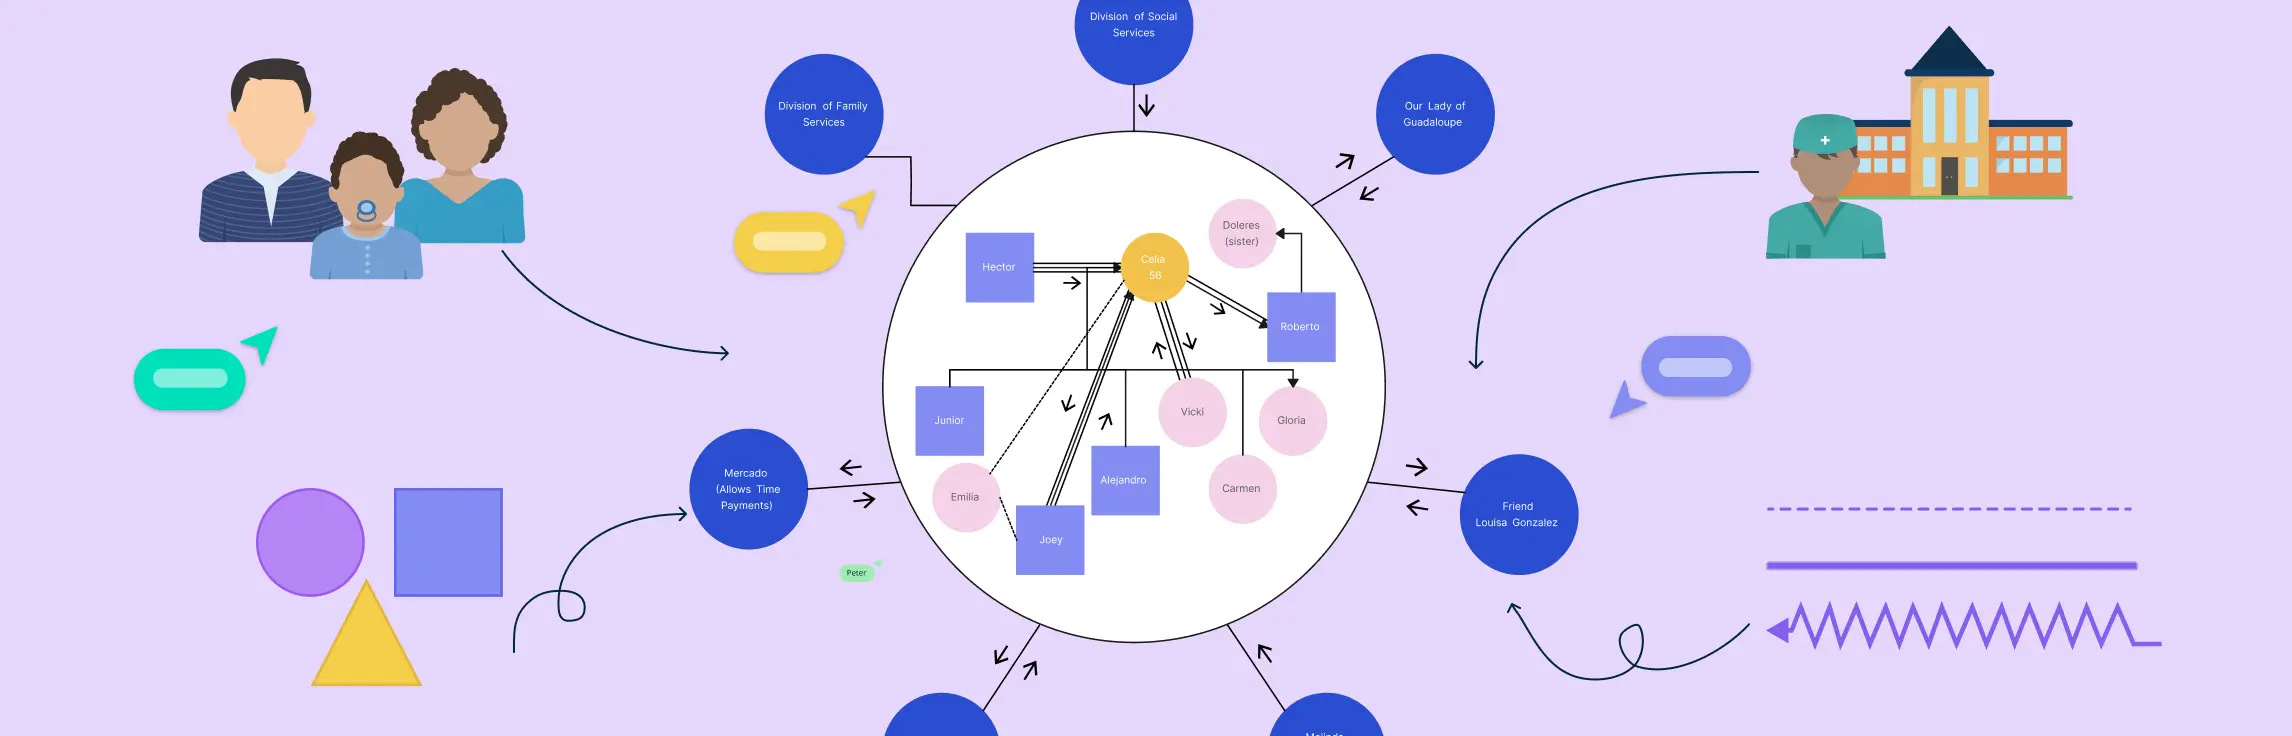
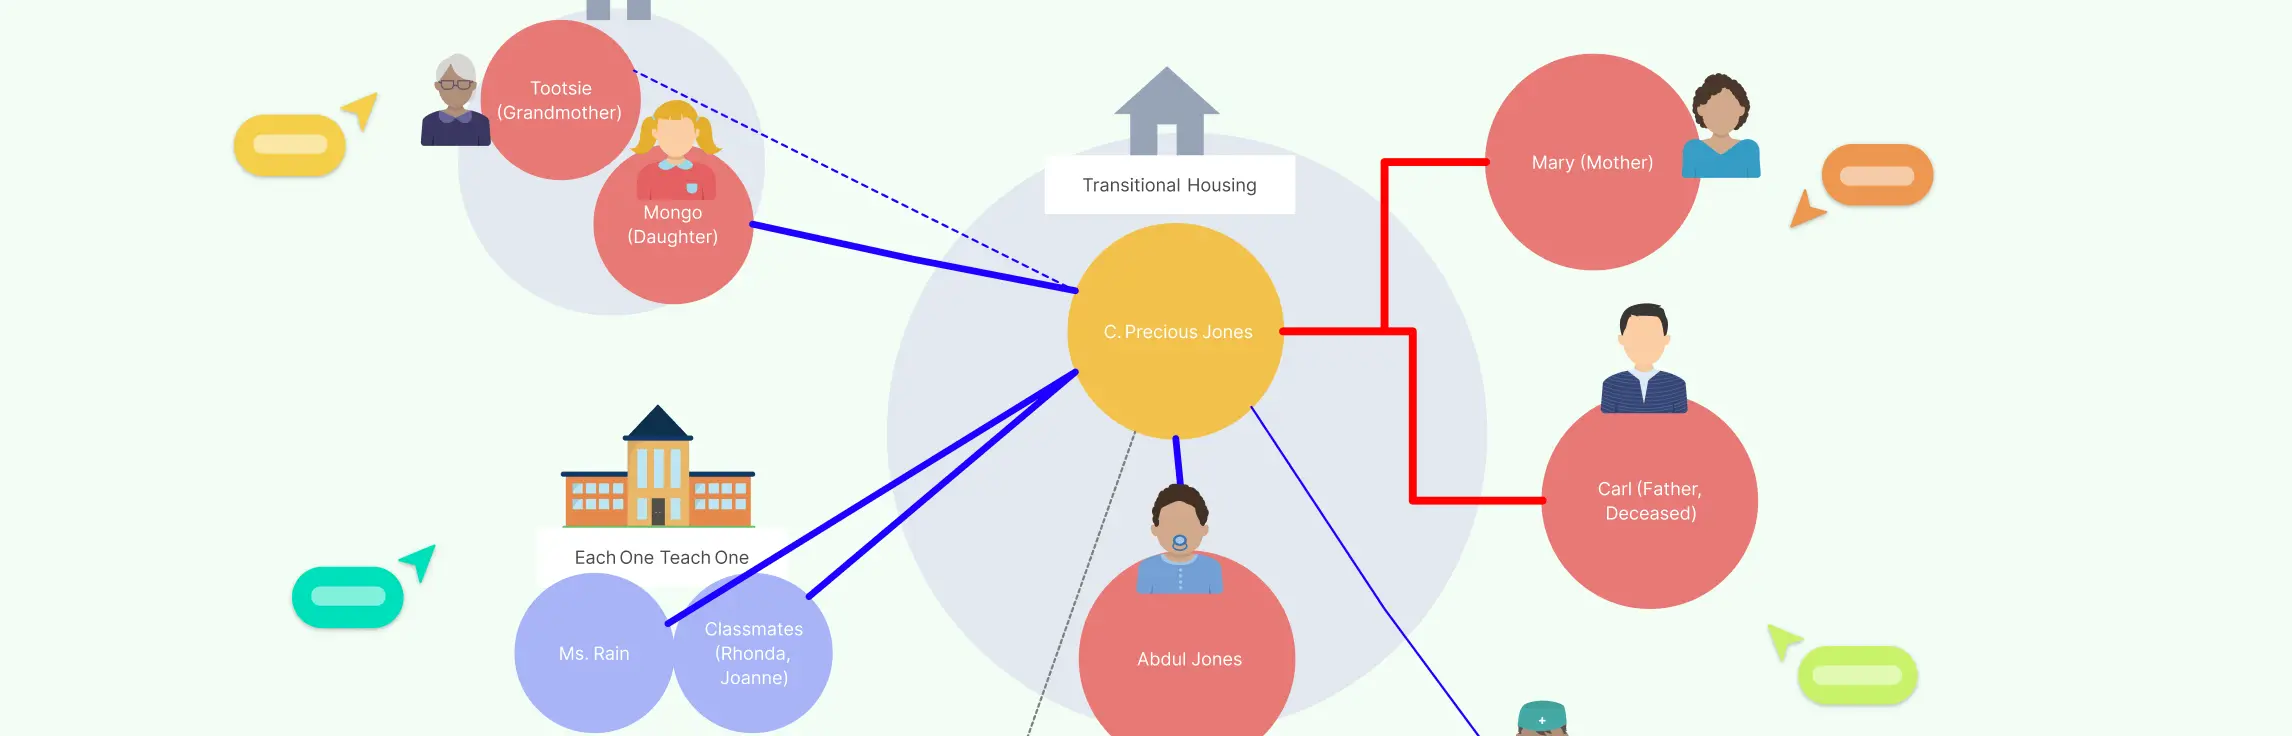
An ecomap is a visual way to understand how a person or family connects to the people, services, and systems around them. It helps you quickly see where support is strong, where stress shows up, and which relationships or resources may need more attention.
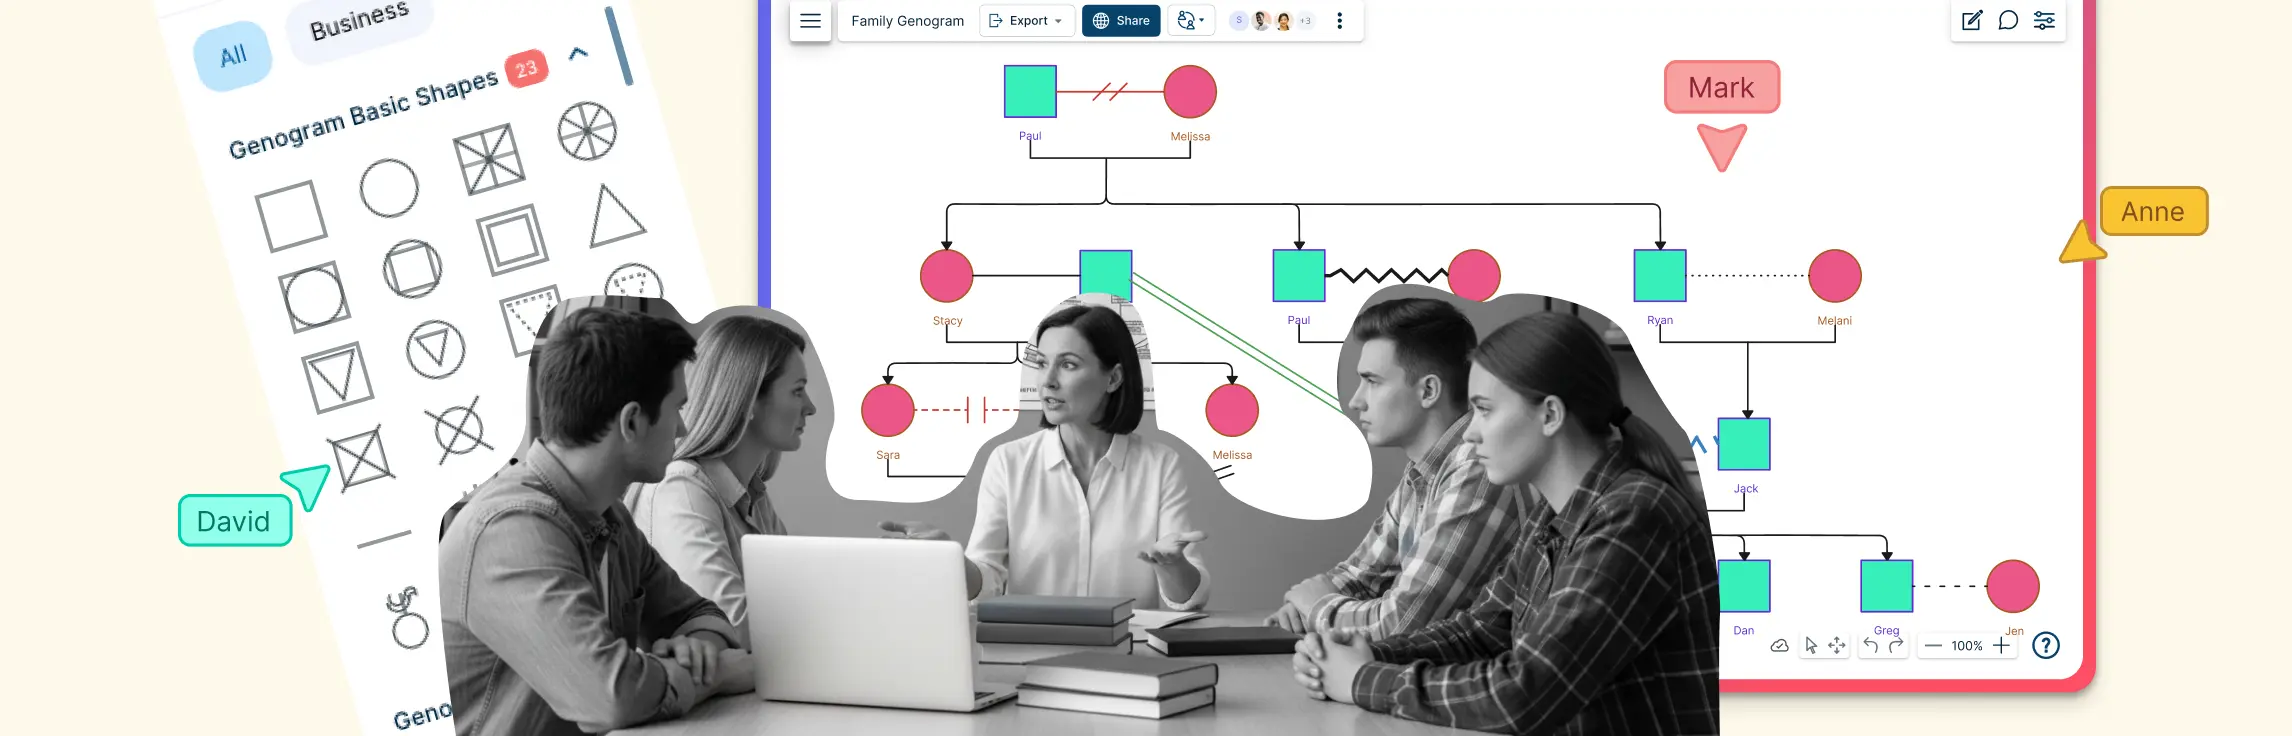
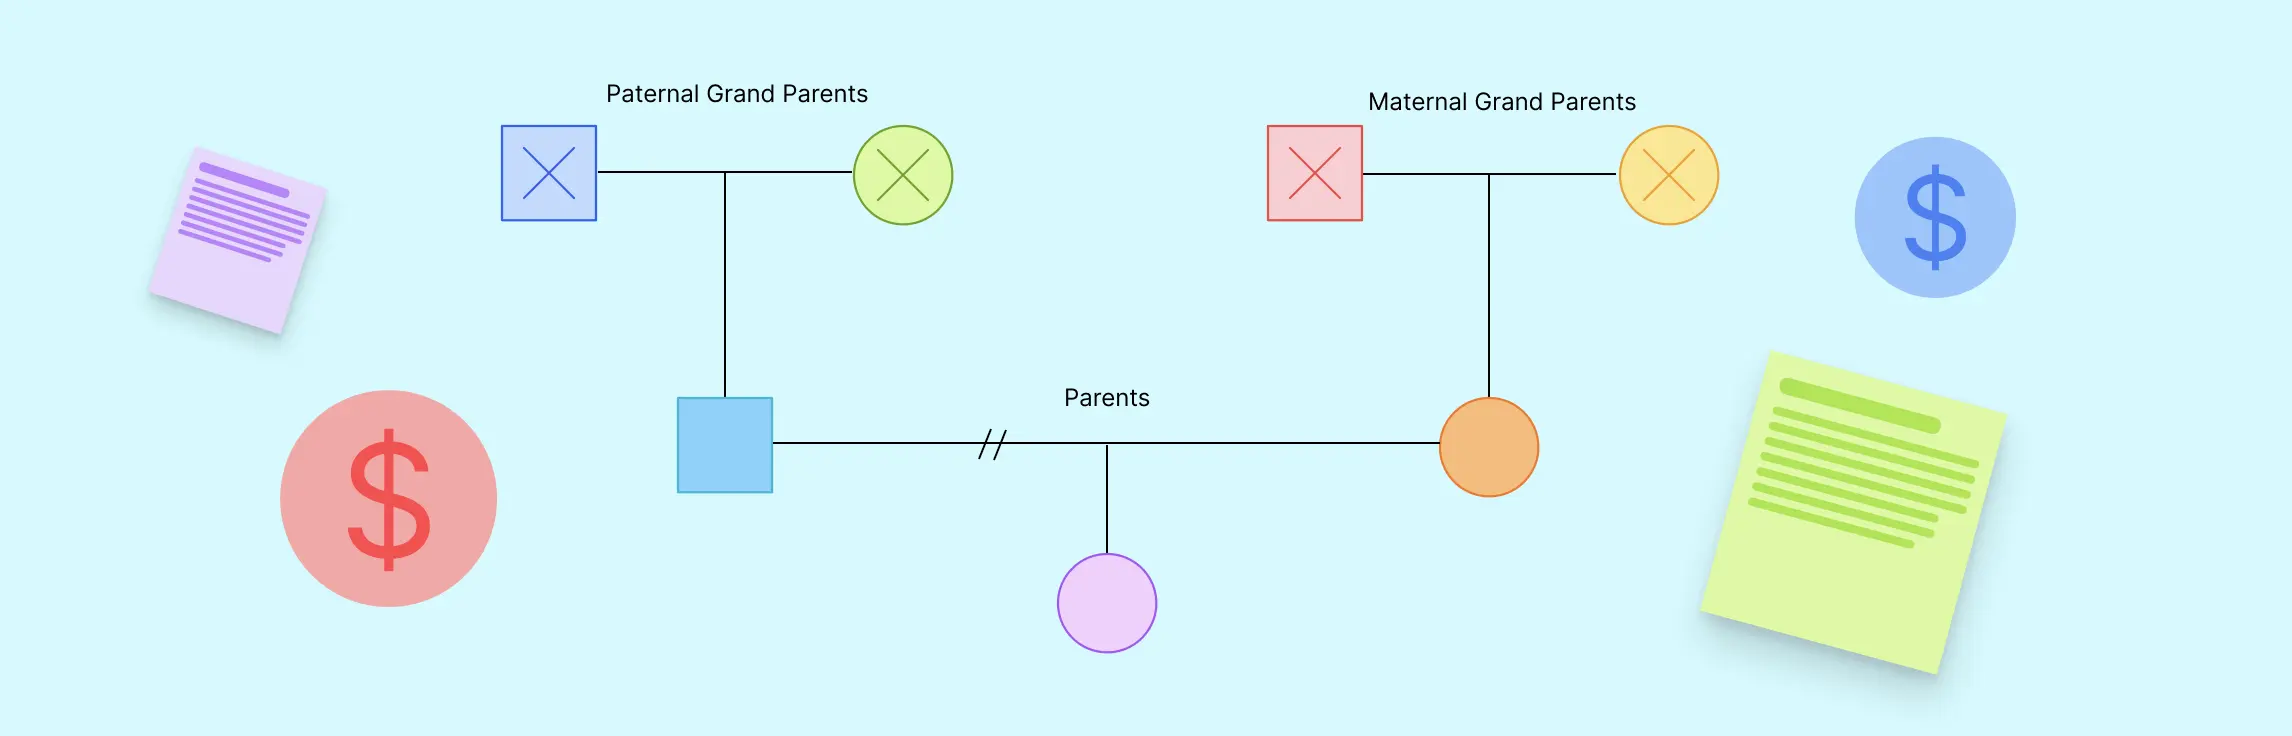
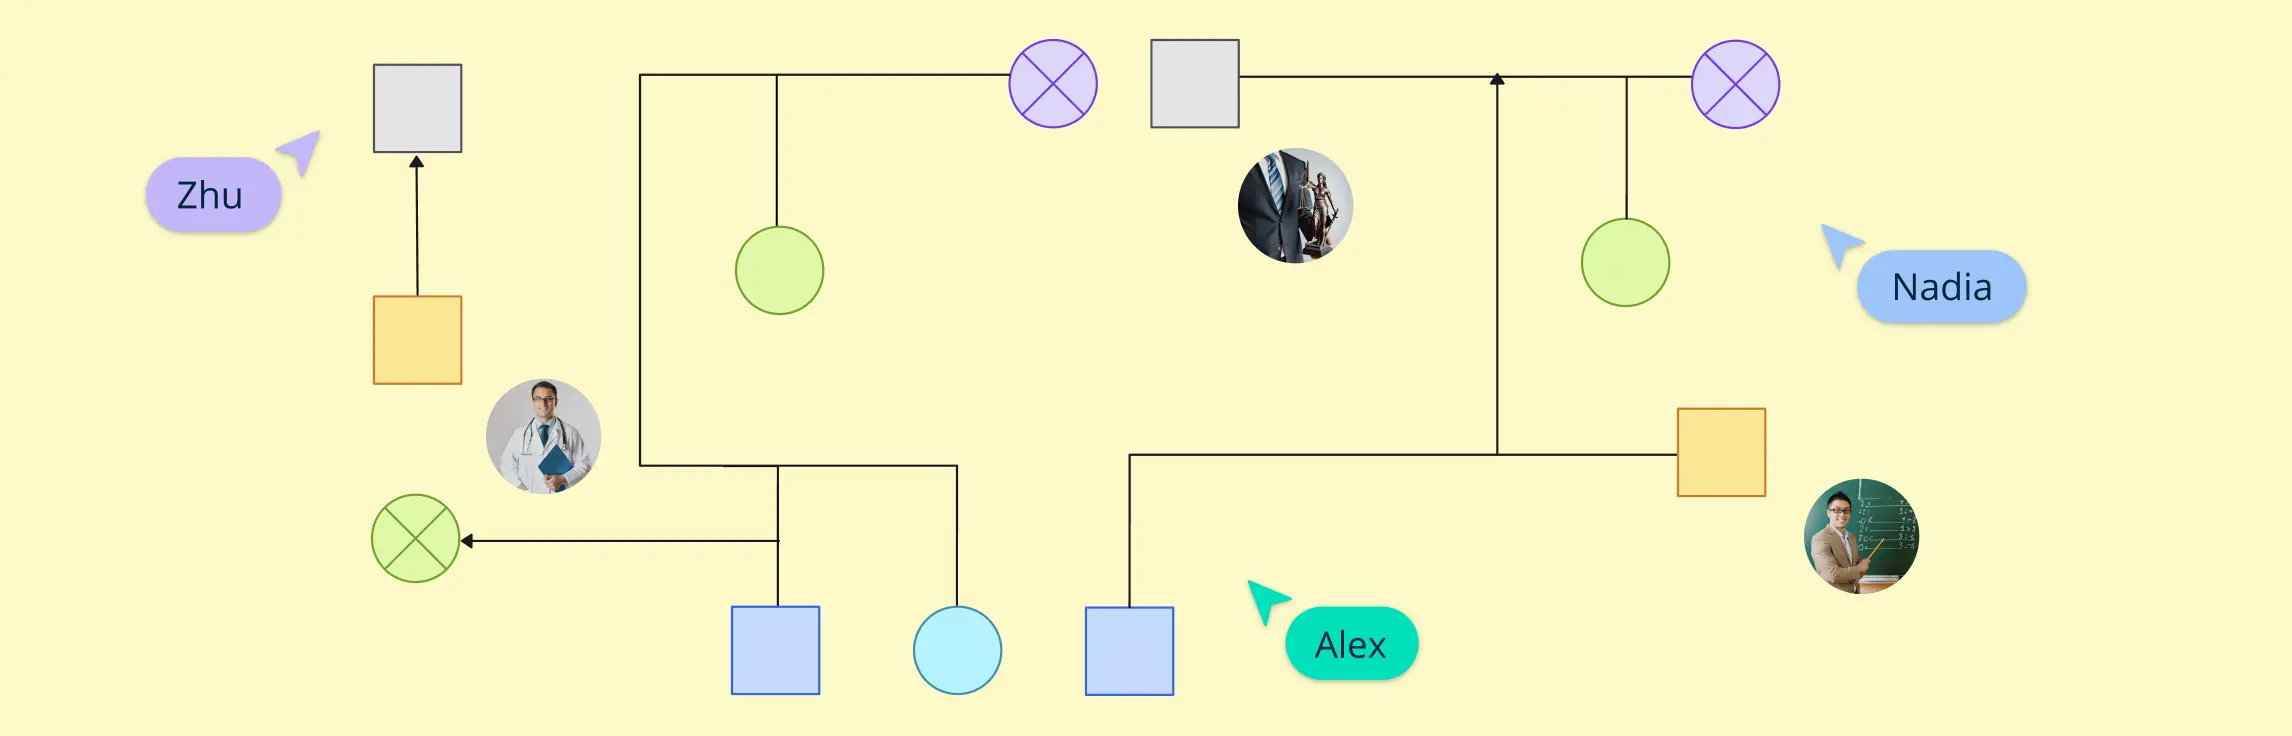
Looking for practical family genogram examples to help map your family’s structure, relationships, and health history? Whether you are charting a modern family genogram, exploring an extended family genogram, or creating a family health history genogram, this guide gives you editable templates to get started. Use these examples to uncover generational patterns and build a clearer, more structured family genogram.
In social work practice, a genogram helps practitioners move beyond a basic family tree and see the patterns surrounding a client’s life more clearly. It can bring family structure, caregiving roles, conflict, trauma, mental health history, and support systems into one visual assessment tool.
Ecomap examples help you quickly see how a person or family is connected to relatives, services, schools, care teams, and community resources. Instead of starting with a blank canvas, you can review a familiar pattern, choose the closest fit, and adapt it to the situation you are assessing.
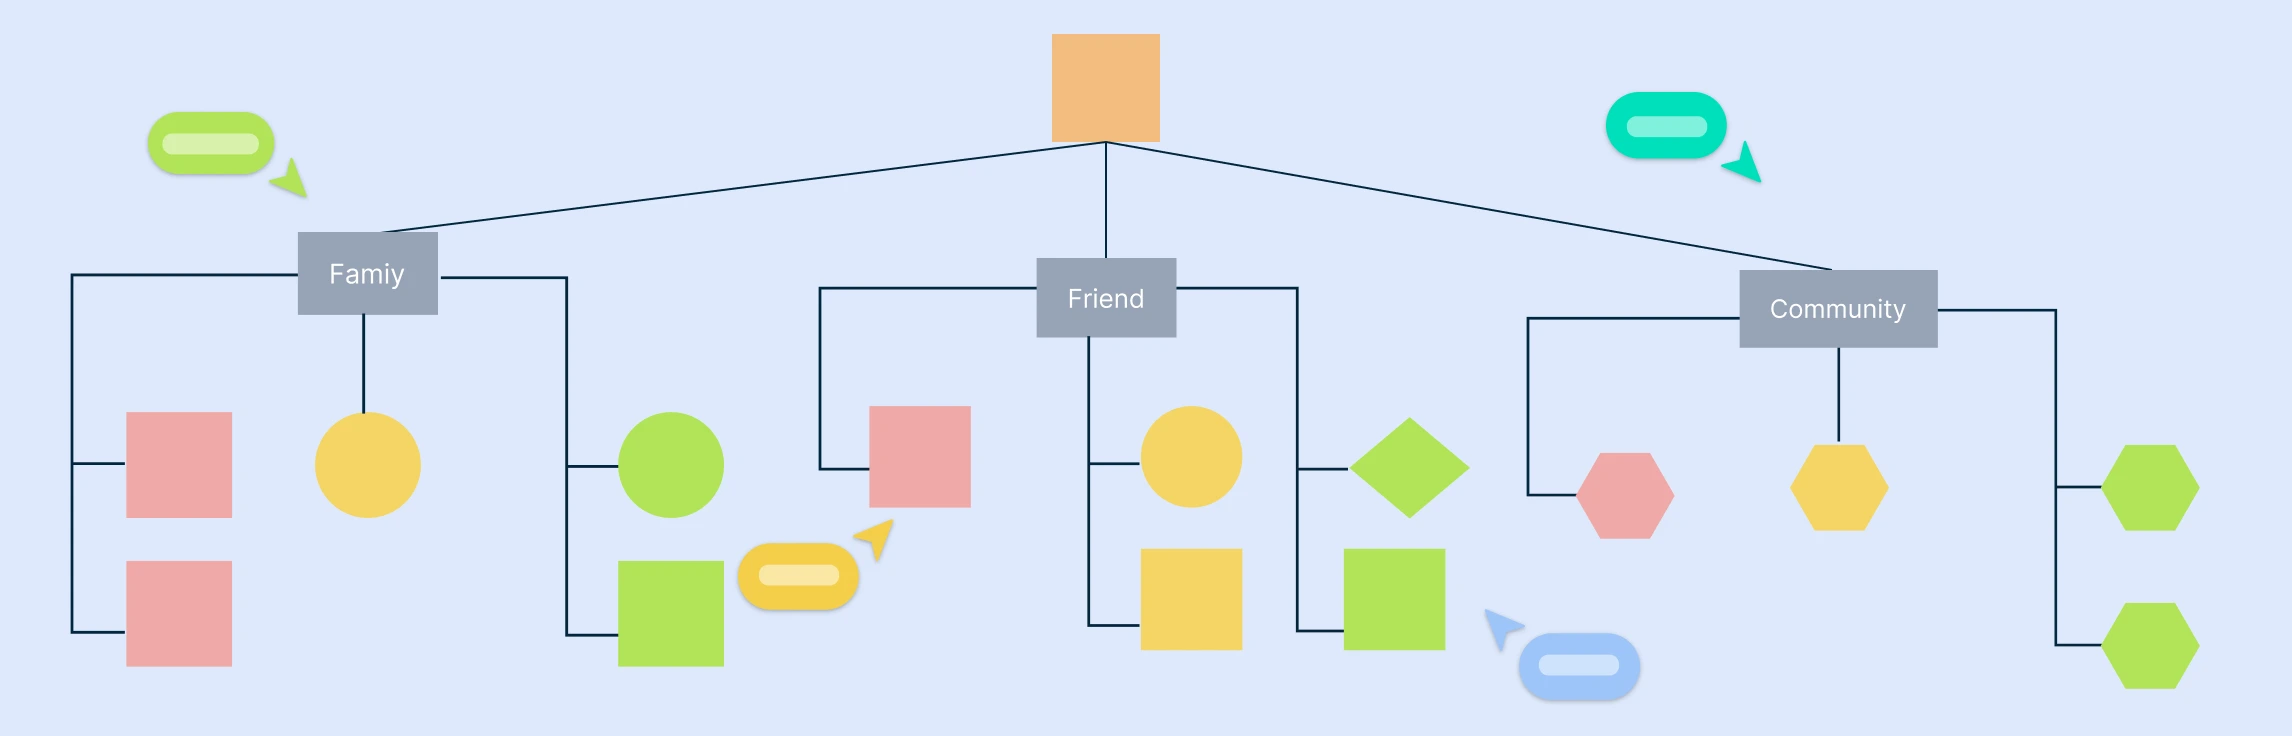
Understanding how people, services, and institutions connect within a shared environment can be difficult, but a community genogram makes those relationships easier to see. Unlike a family-only diagram, it helps map the broader support systems around schools, clinics, nonprofits, neighborhoods, and other community spaces.
A counseling genogram is a therapeutic tool that visually maps family relationships, emotional patterns, and generational influences. It helps therapists identify hidden dynamics, sources of trauma, and behavioral patterns, providing deeper insight into a client’s emotional history. Commonly used in various therapy settings, it supports meaningful conversations and personal growth.
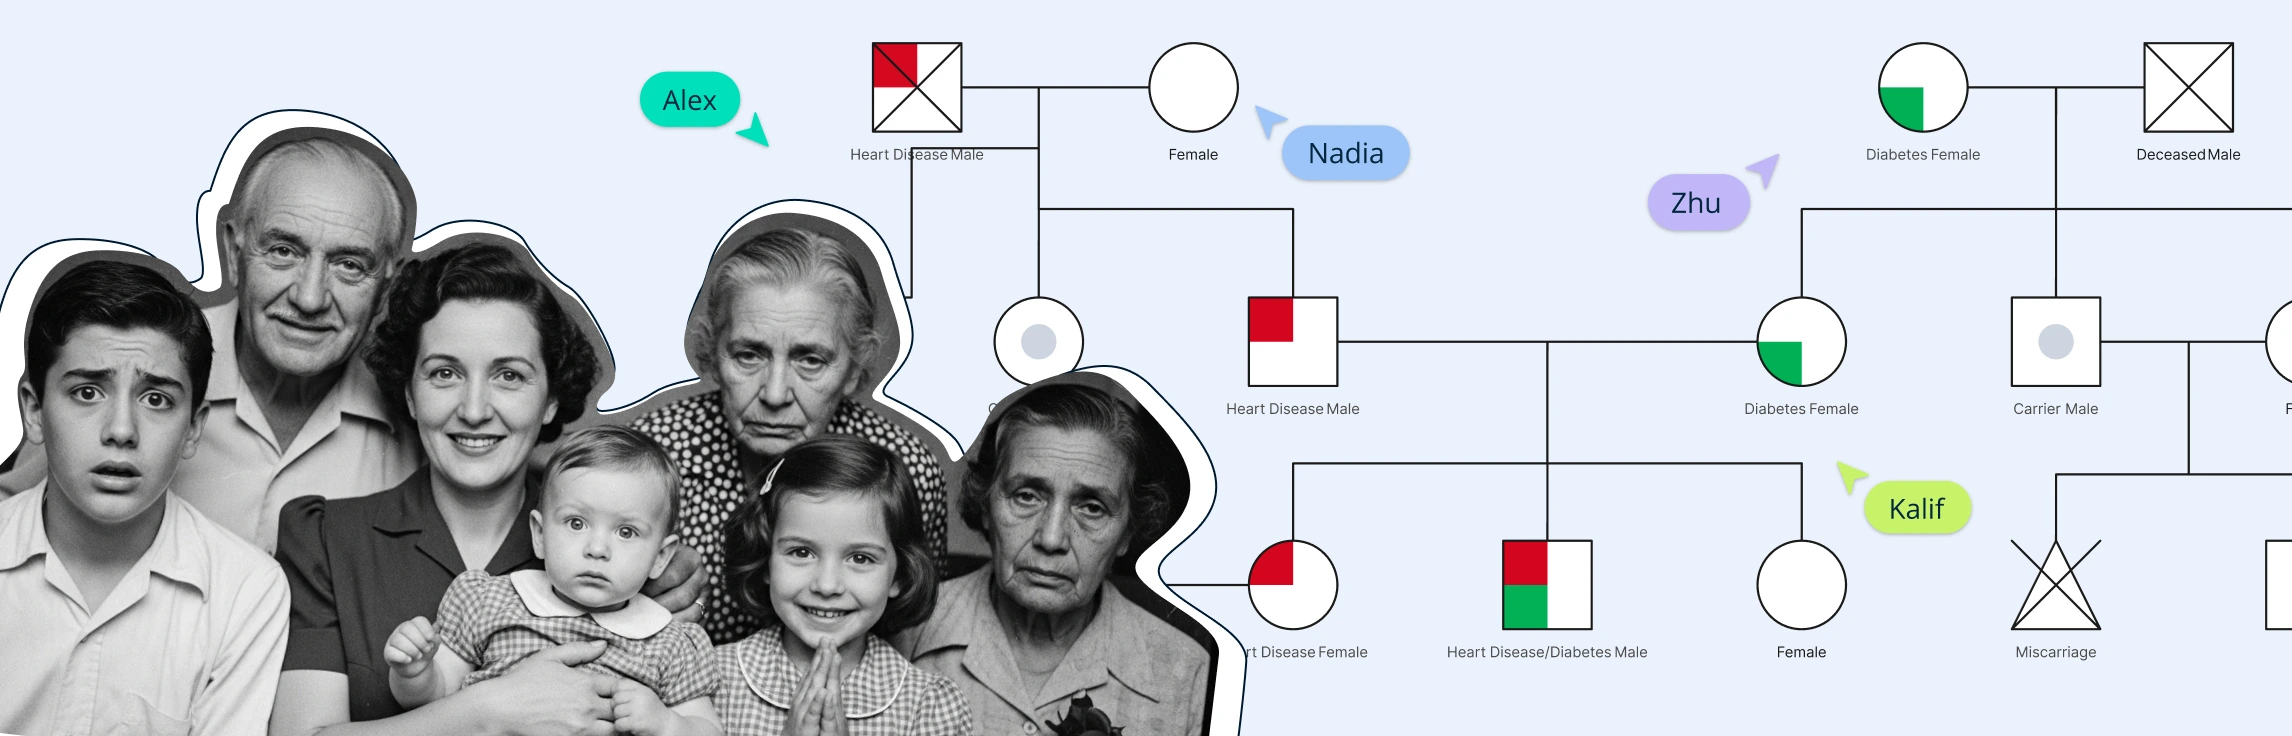
Genograms for health history are enhanced family trees that visually track hereditary medical conditions, mental health issues, and chronic diseases across generations. Unlike traditional family trees, they help individuals and professionals assess genetic risks and plan early interventions. This guide offers 10 editable genogram examples for health history.
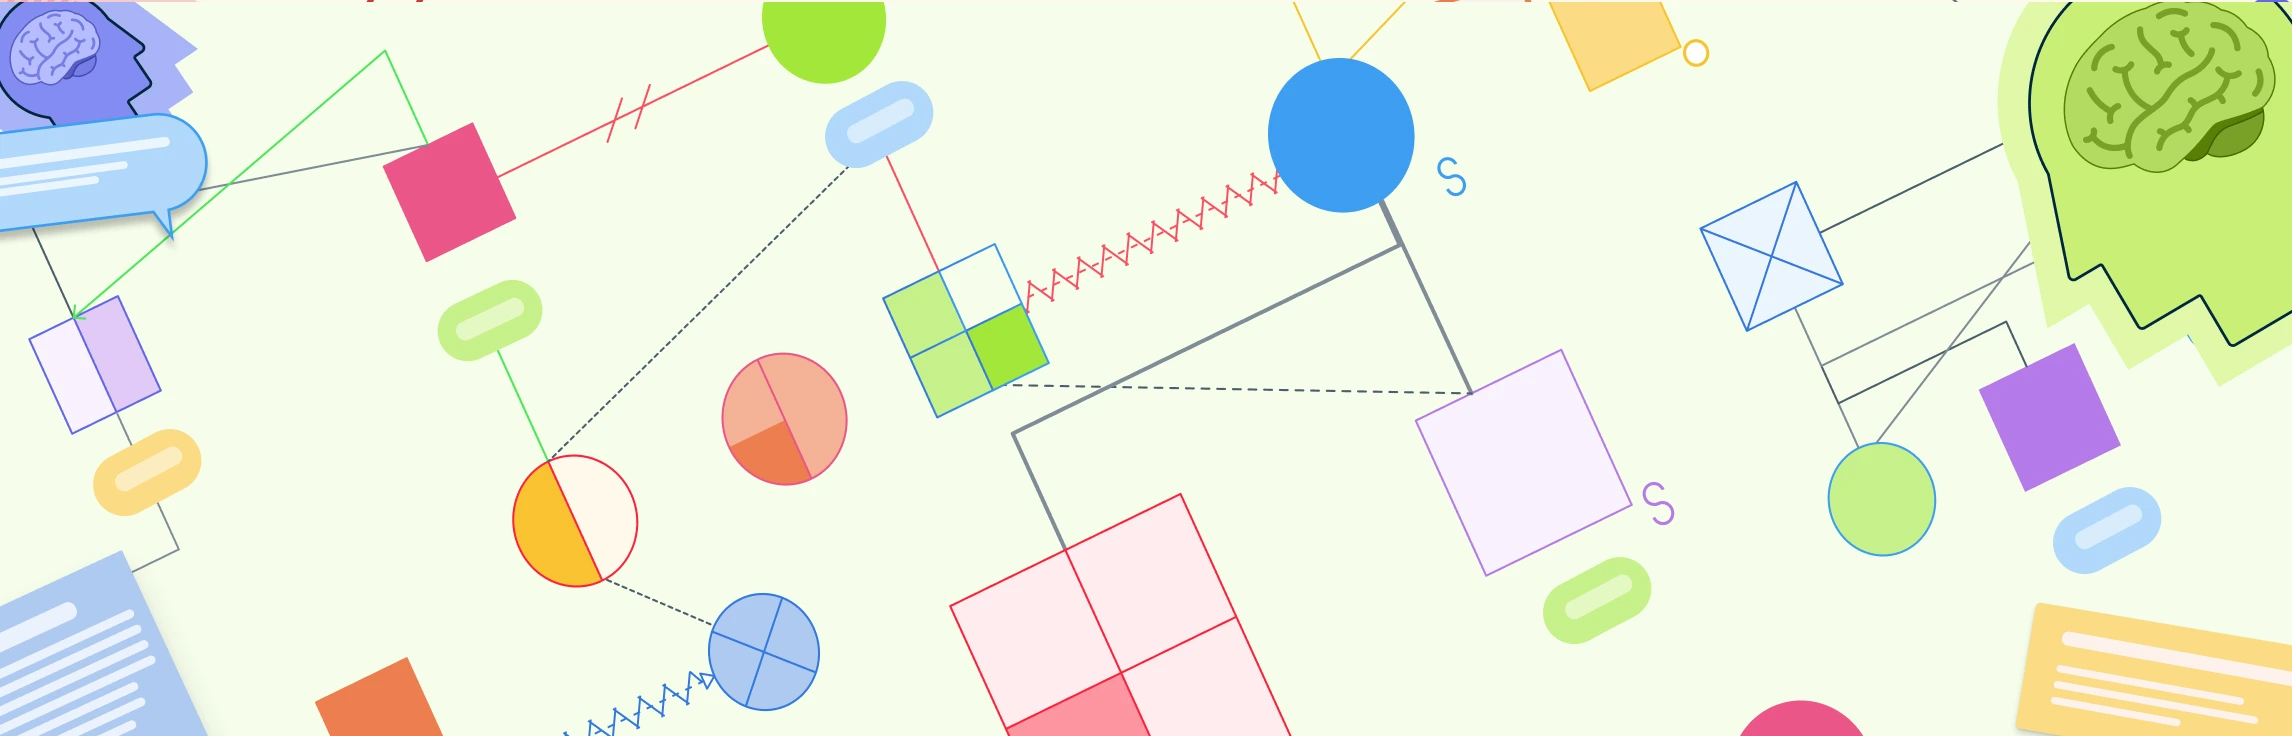
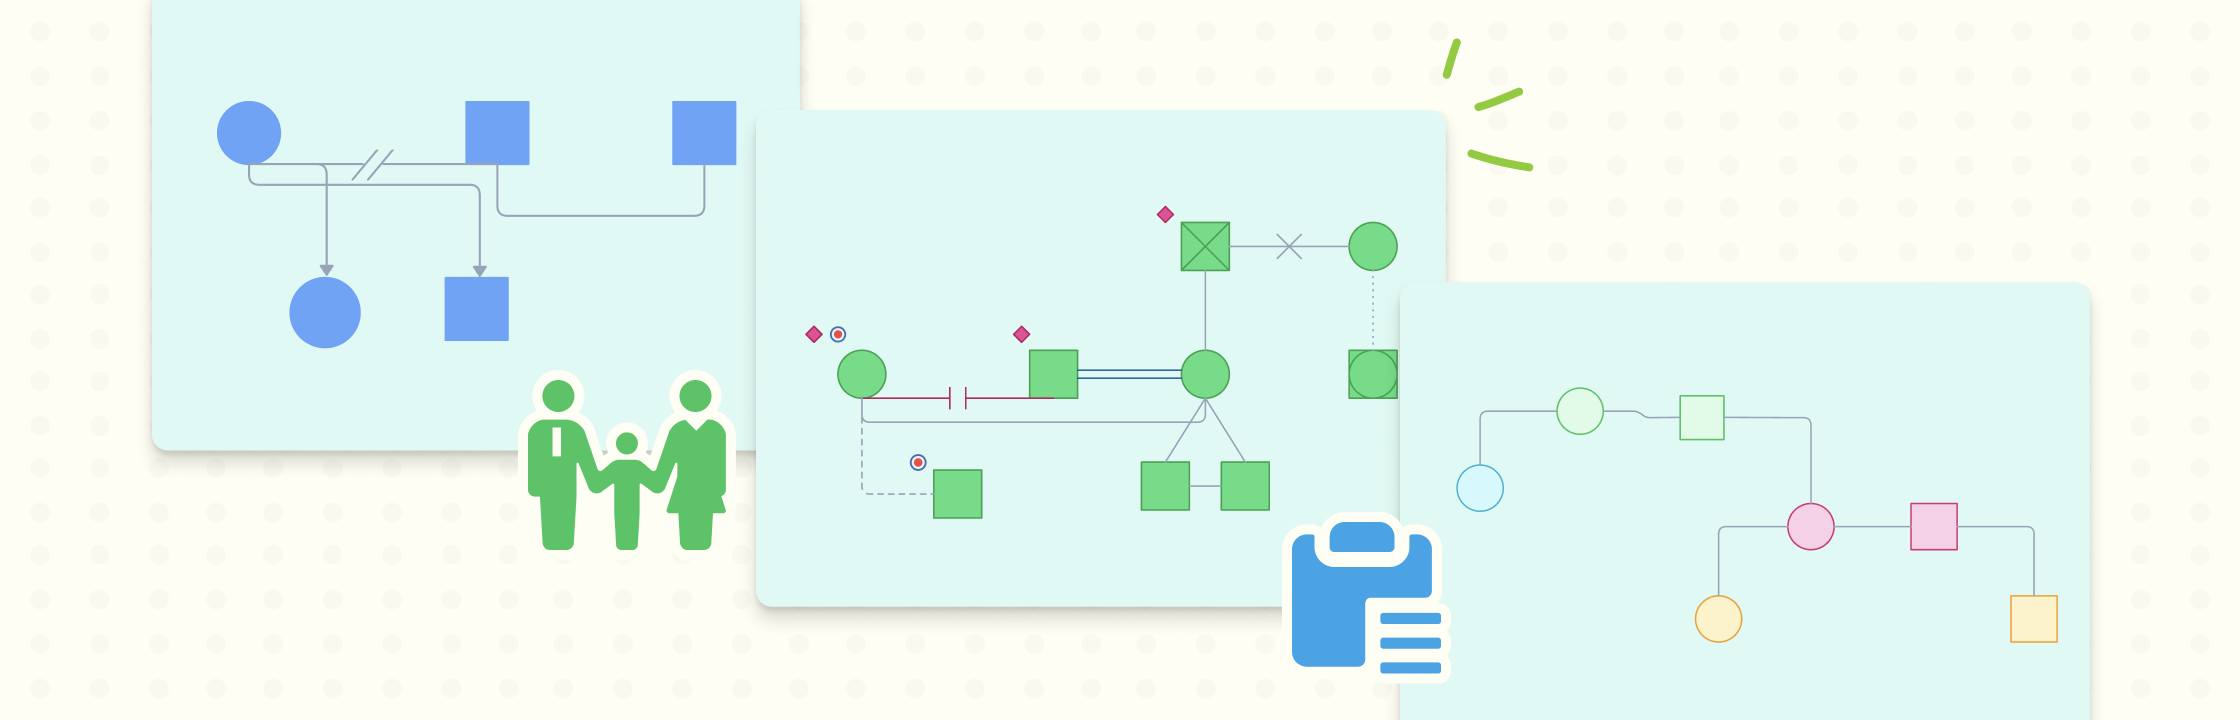
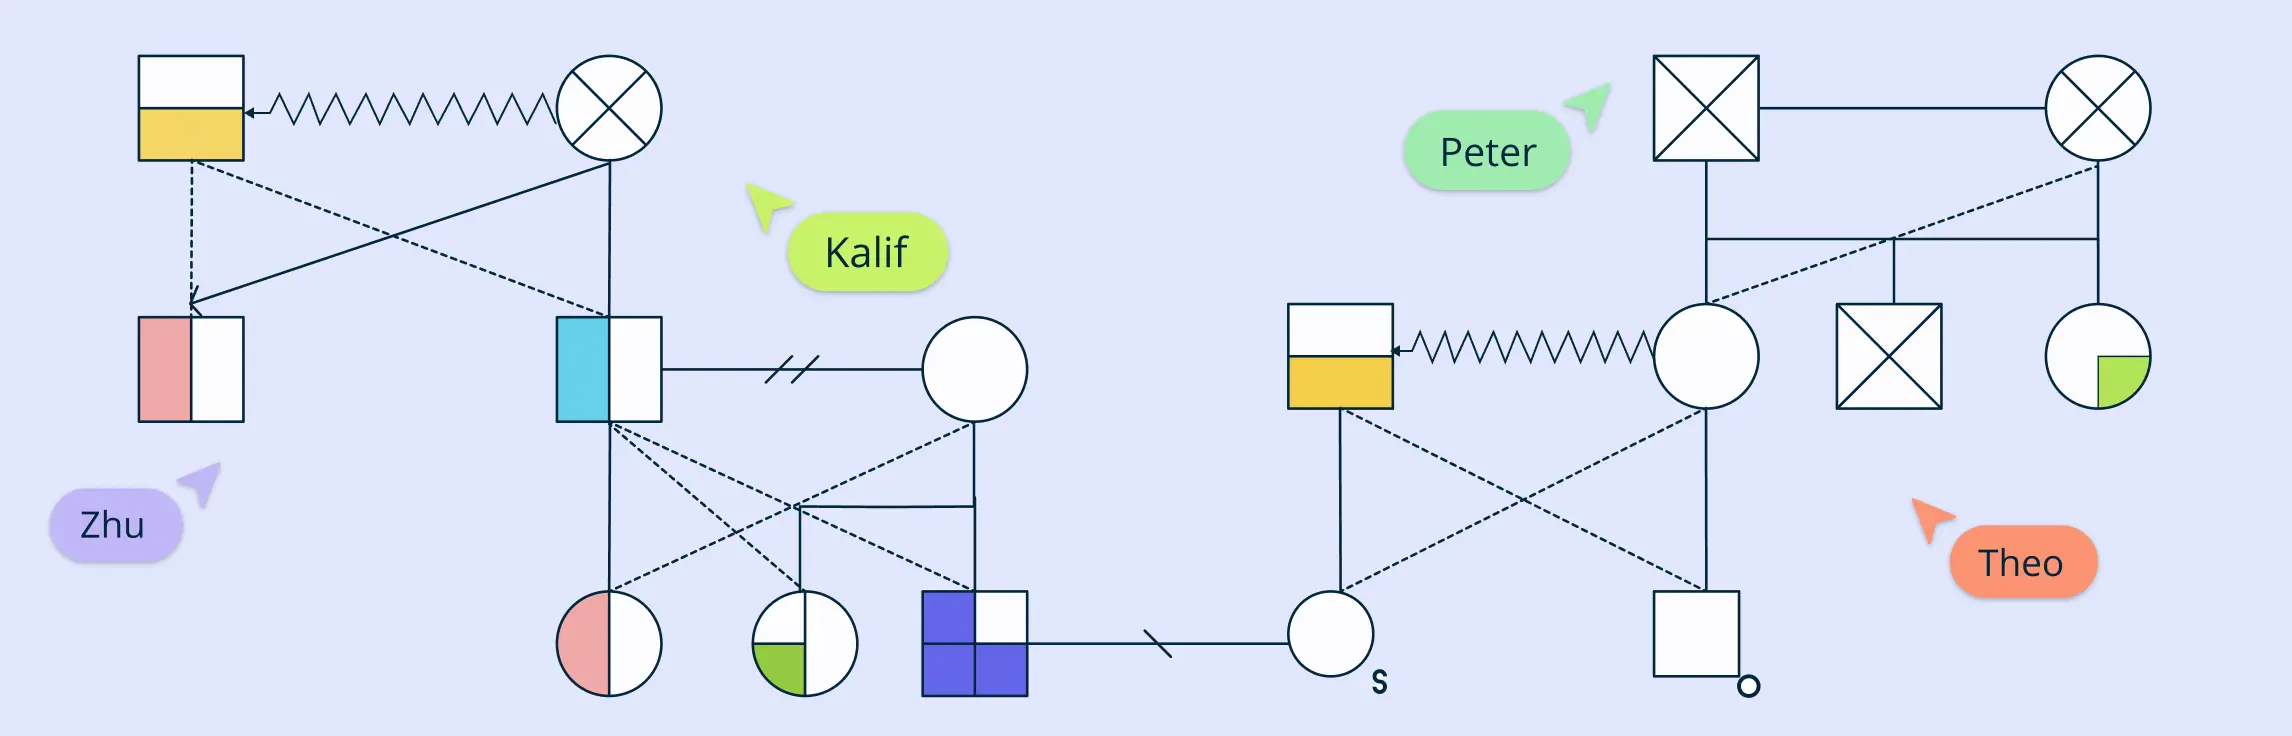
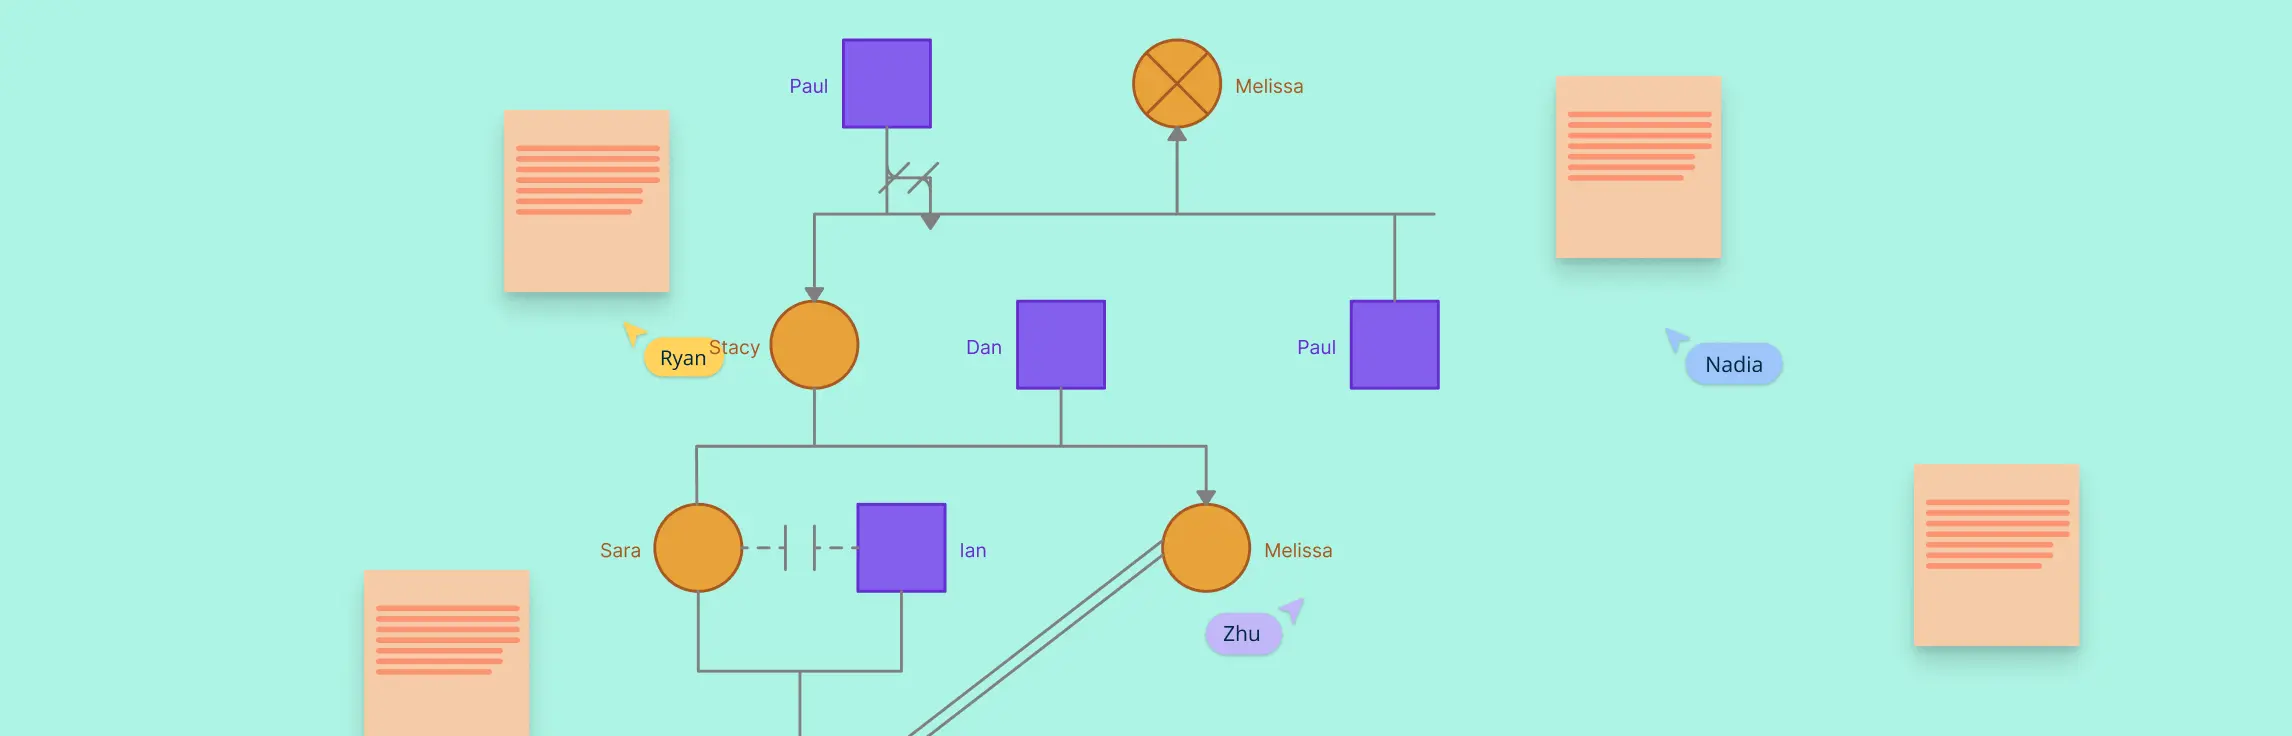
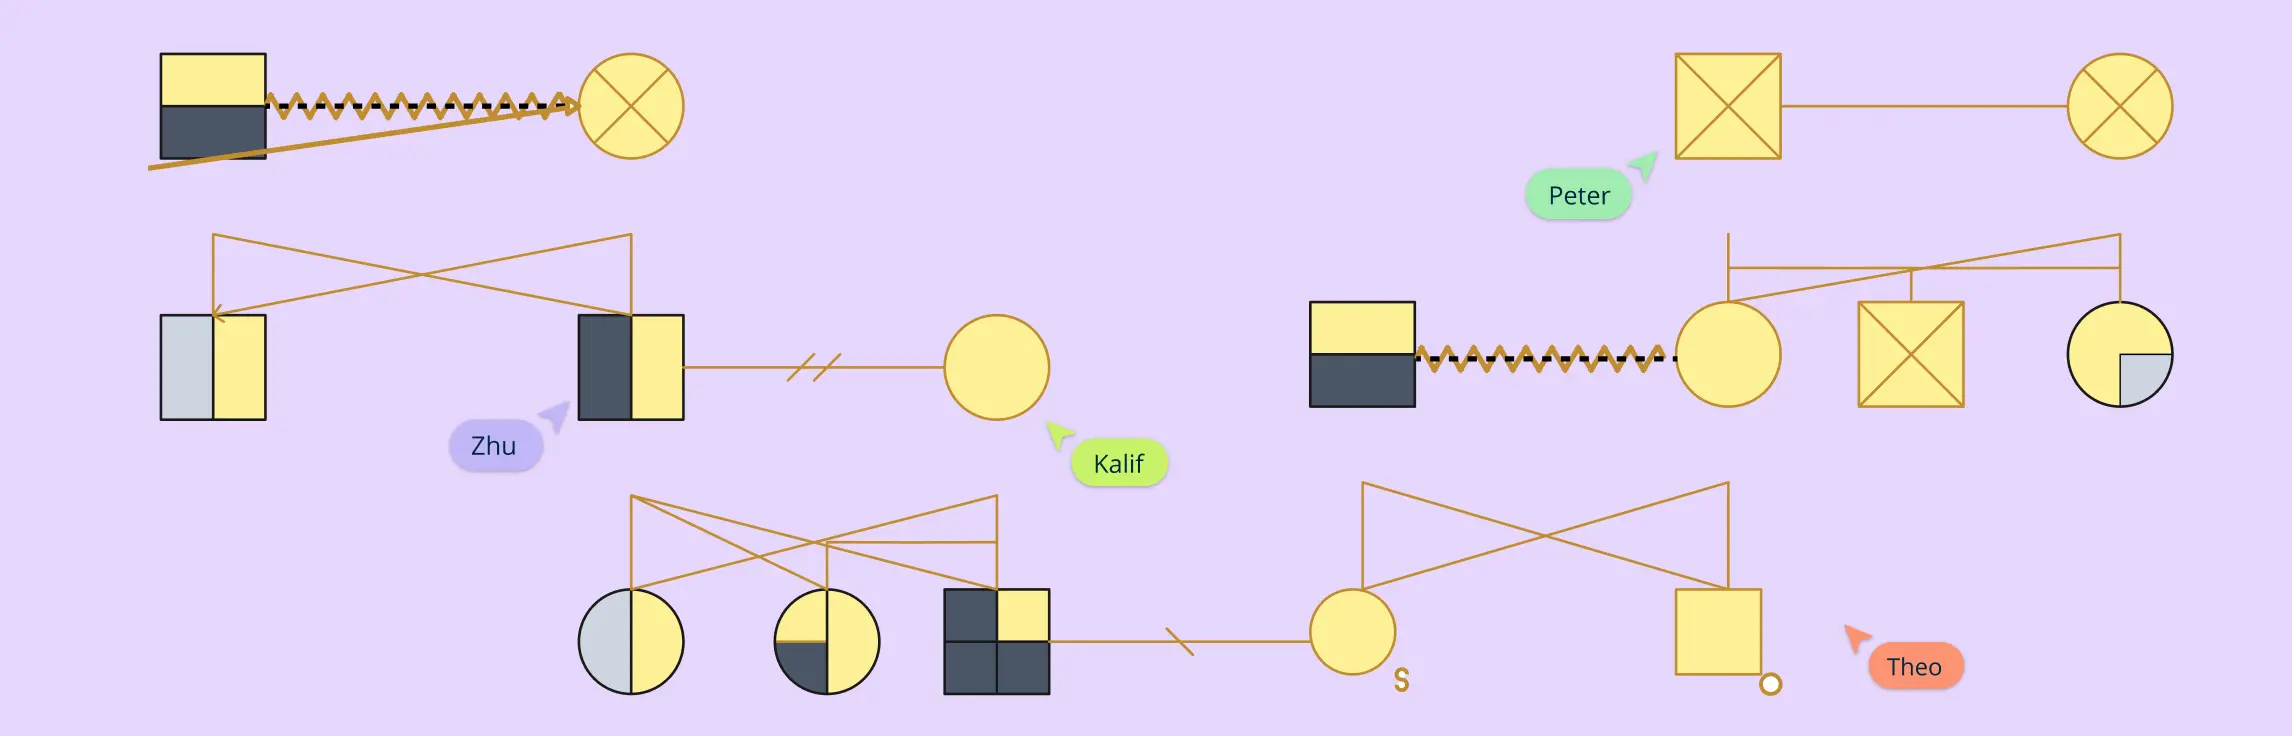
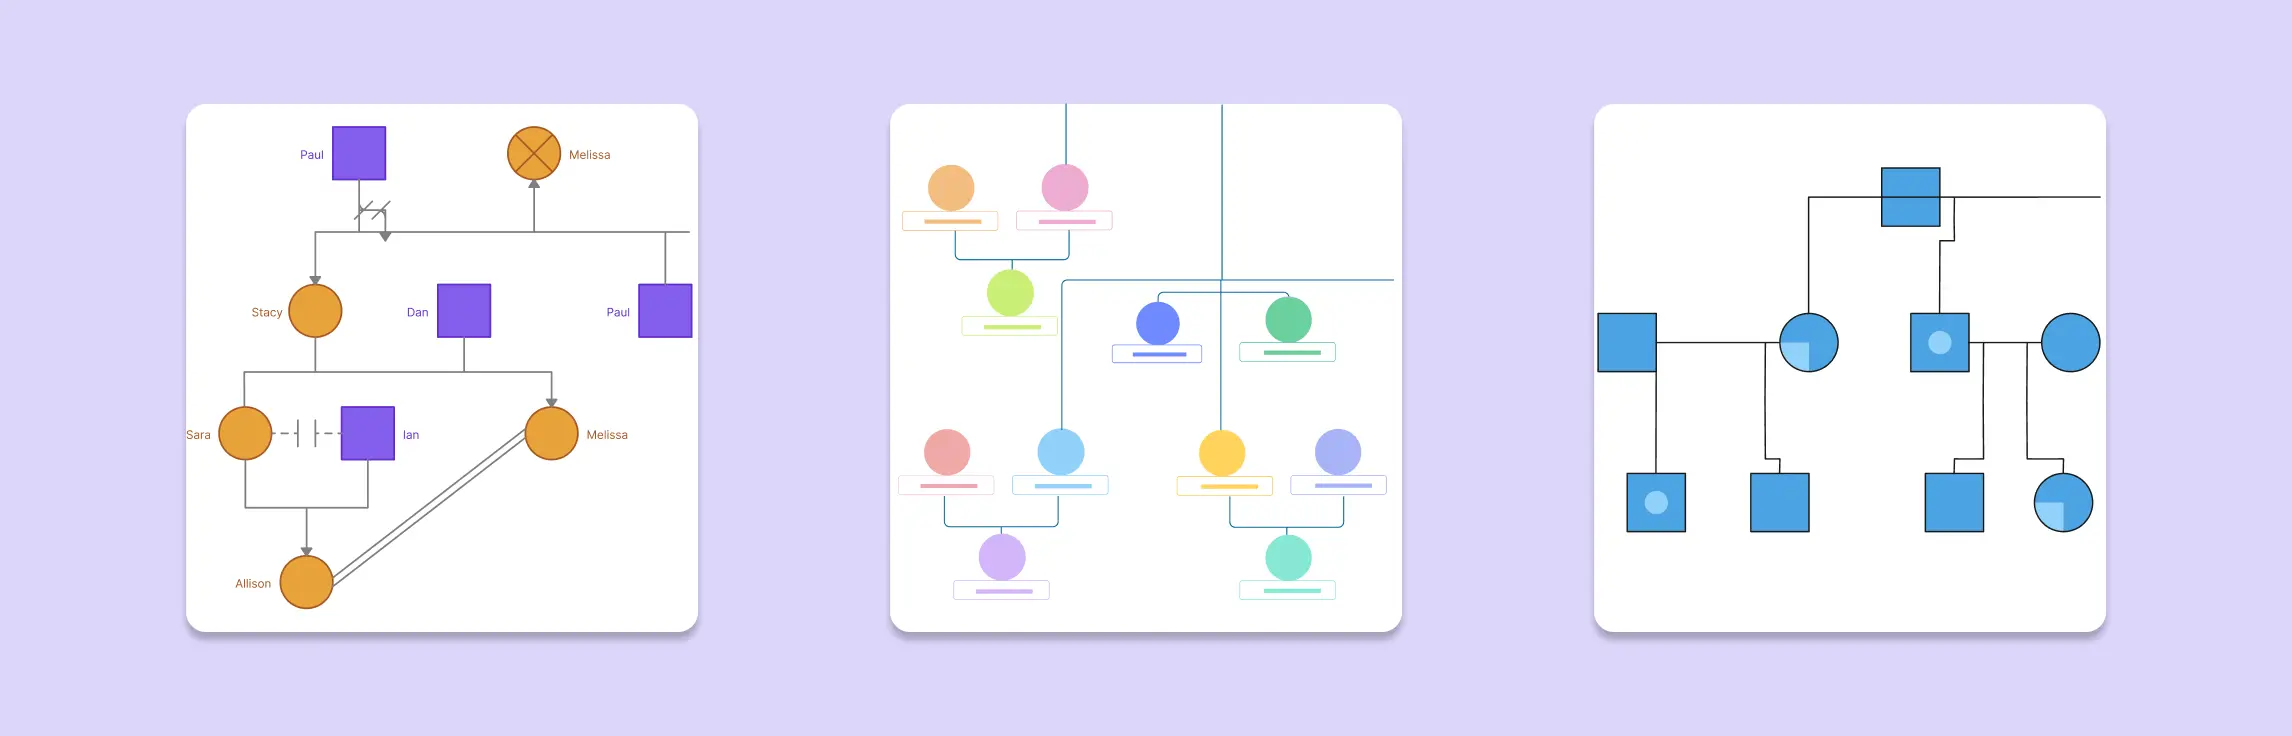
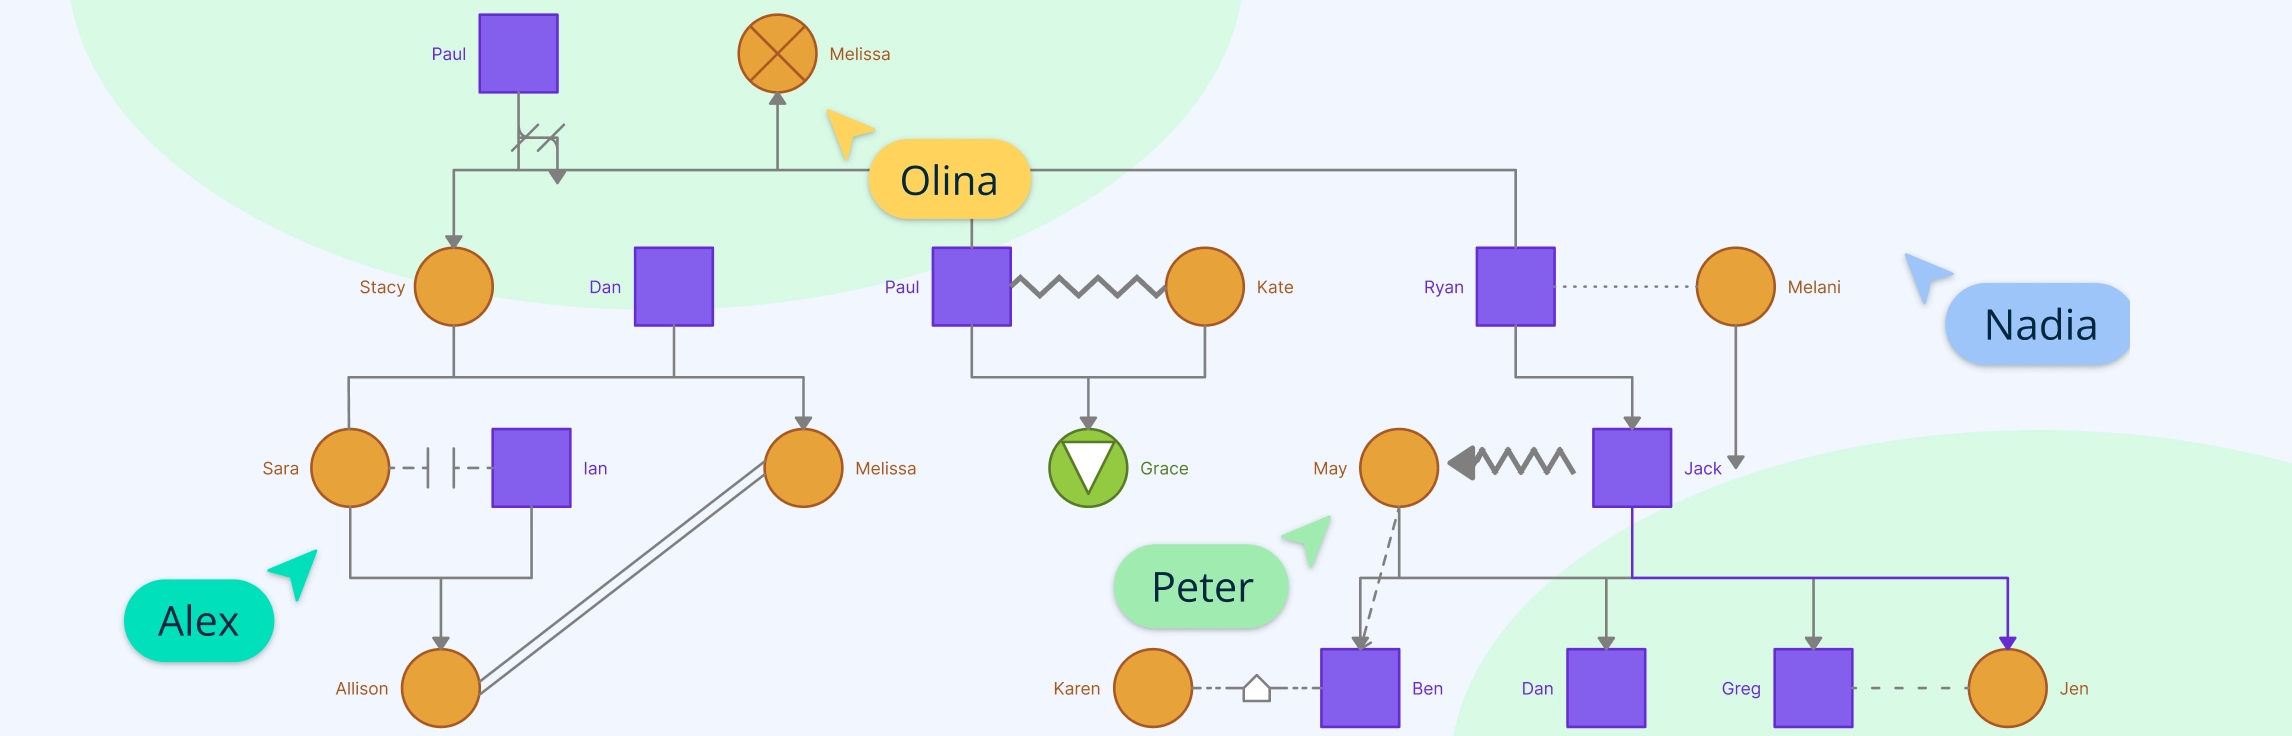
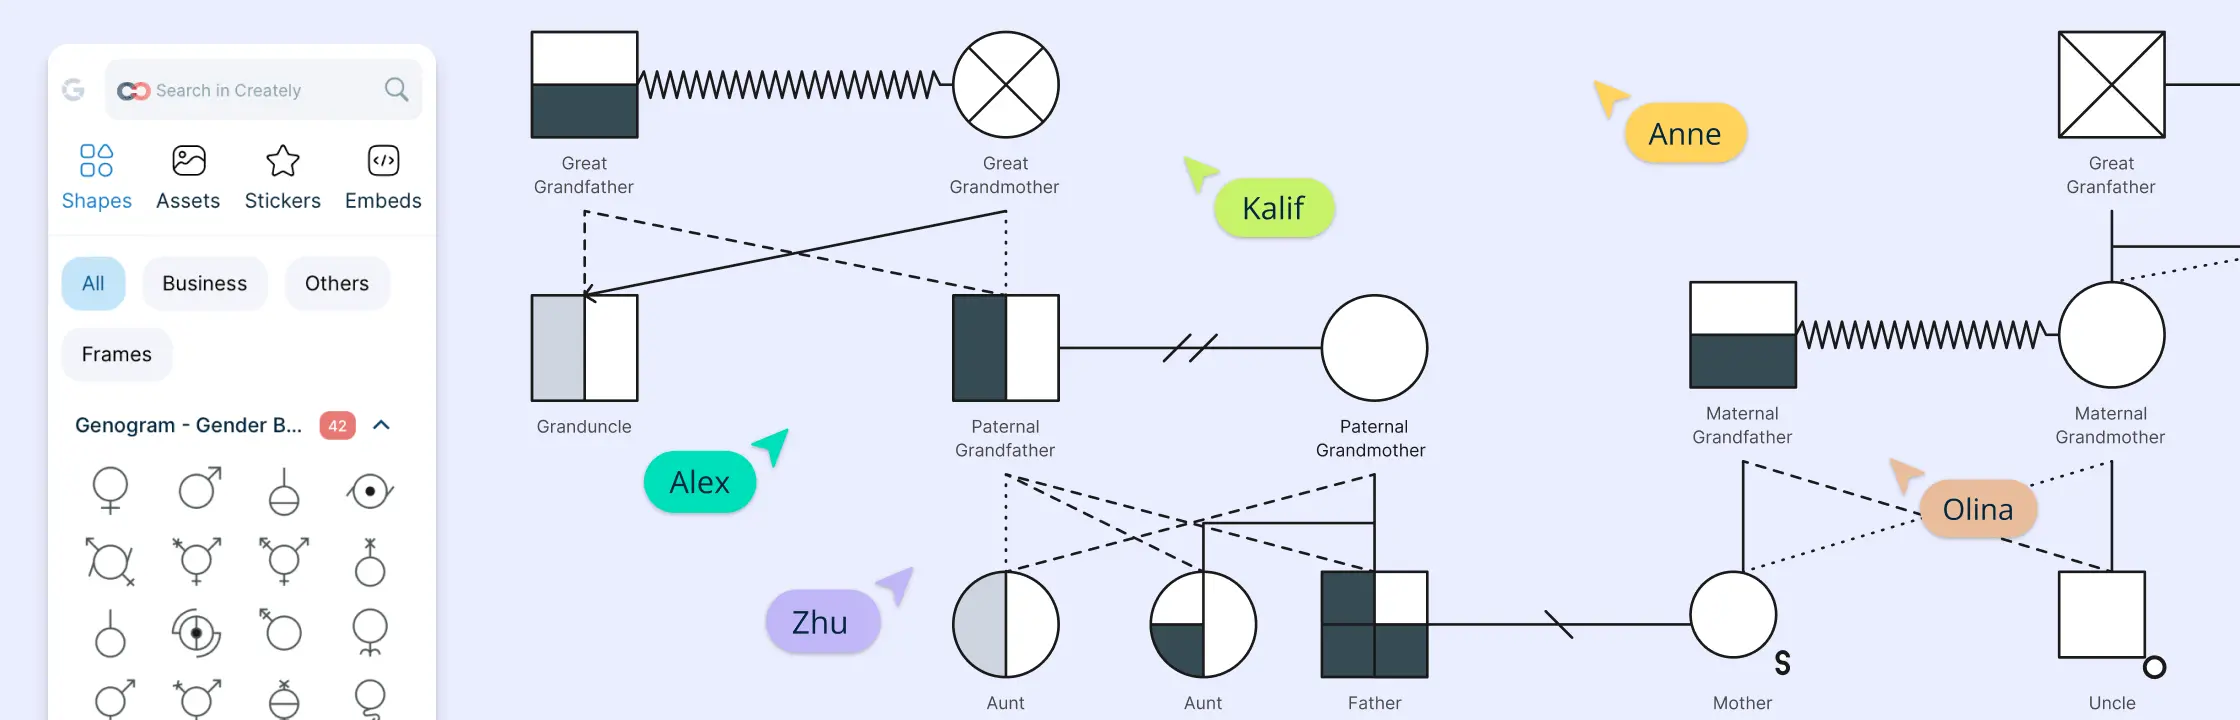
Genogram symbols make it easier to understand family structures, relationships, emotional dynamics, and health patterns at a glance. The most widely used genogram notation is based on the McGoldrick-Gerson-Petry format, outlined in Genograms: Assessment and Treatment, 4th edition, by Monica McGoldrick, Randy Gerson, and Sueli Petry. This guide walks you through the commonly used person symbols and relationship lines, explains how to tell similar symbols apart, and shows you how to use a legend so your genogram can be interpreted correctly.
Families are deeply connected to the world around them—through people, places, and systems that offer support or create stress. This comprehensive family ecomap guide walks you through why ecomaps matter, what to include, and how to create one step by step. Whether you’re a social worker, therapist, teacher, or simply interested in family dynamics, this will help you use ecomaps with confidence and care.
This comprehensive mental health genogram guide explains what a mental health genogram is, how to create one, its benefits, limitations and more. It maps family history and emotional patterns to reveal repeating mental health issues. See real world examples with templates and learn how therapists use this tool in practice.
To create an ecomap, place the person or family in the center, map the people and systems around them, and use line styles and arrows to show the quality and direction of each relationship. Done well, an ecomap quickly shows sources of support, pressure, and disconnection. This guide explains the process step by step for social work, counseling, education, healthcare, and personal reflection.
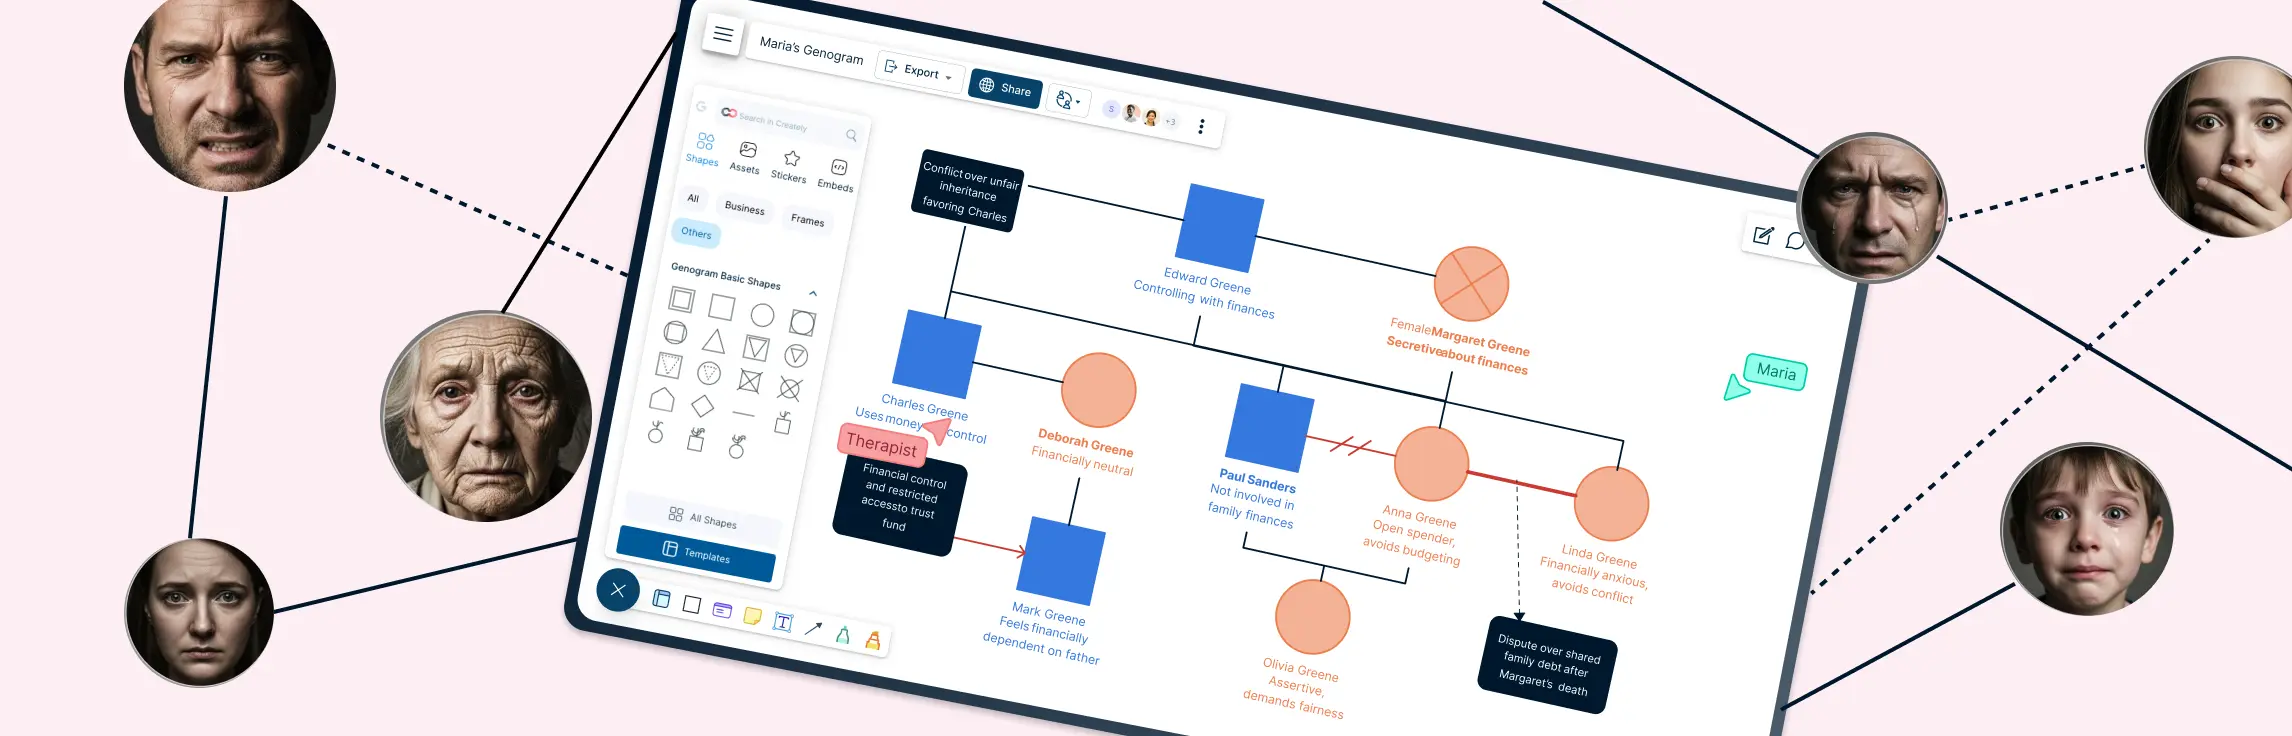
Genograms are powerful tools that help us understand family relationships, personal history, and patterns across different areas of life. They go beyond regular family trees by showing emotional connections, roles, behaviors, and even medical or financial histories.
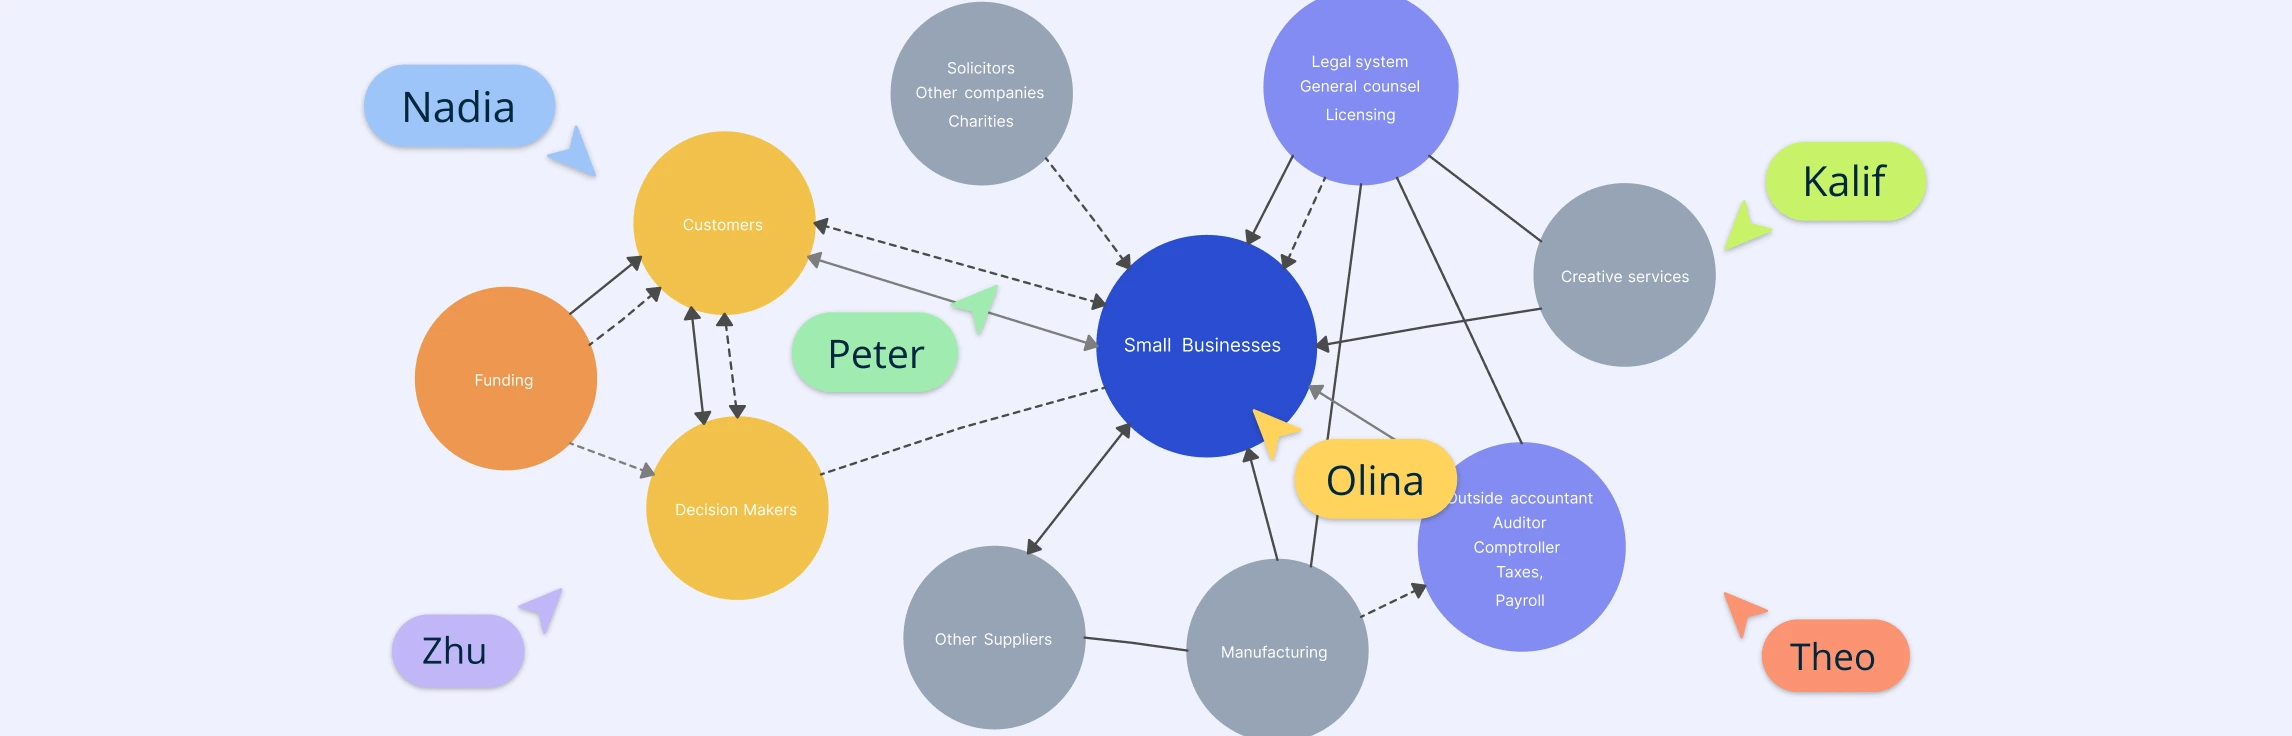
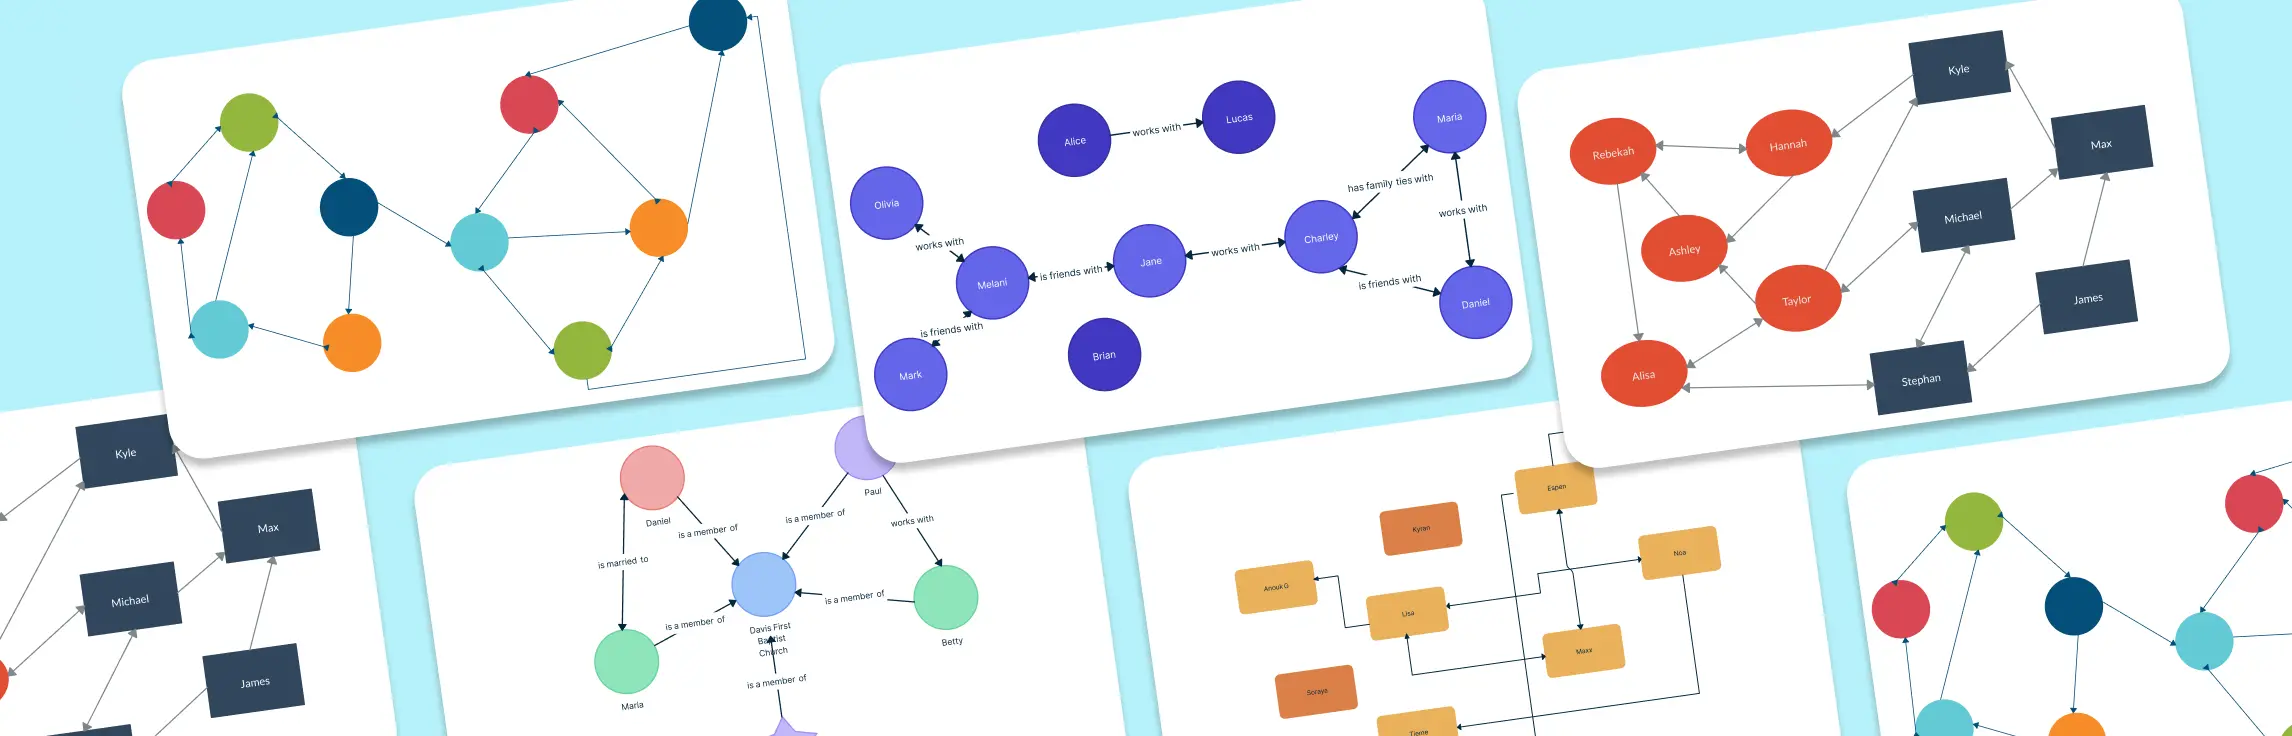
A sociogram is a simple diagram that shows how people are connected within a group. It helps us understand relationships, such as who gets along, who might be left out, and how ideas or influence spread. In this guide, we’ll look at different sociogram examples and ready-to-use sociogram templates you can customize to better understand group behavior.
In the field of social work, understanding a client’s environment is just as important as understanding the client themselves. This is where an ecomap in social work becomes an invaluable tool. It provides a visual snapshot of the client’s social and environmental world, mapping out connections to family, friends, work, community resources, and other influential systems. This guide will help you better understand and apply the ecomap in social work to enhance client systems and support informed intervention planning.
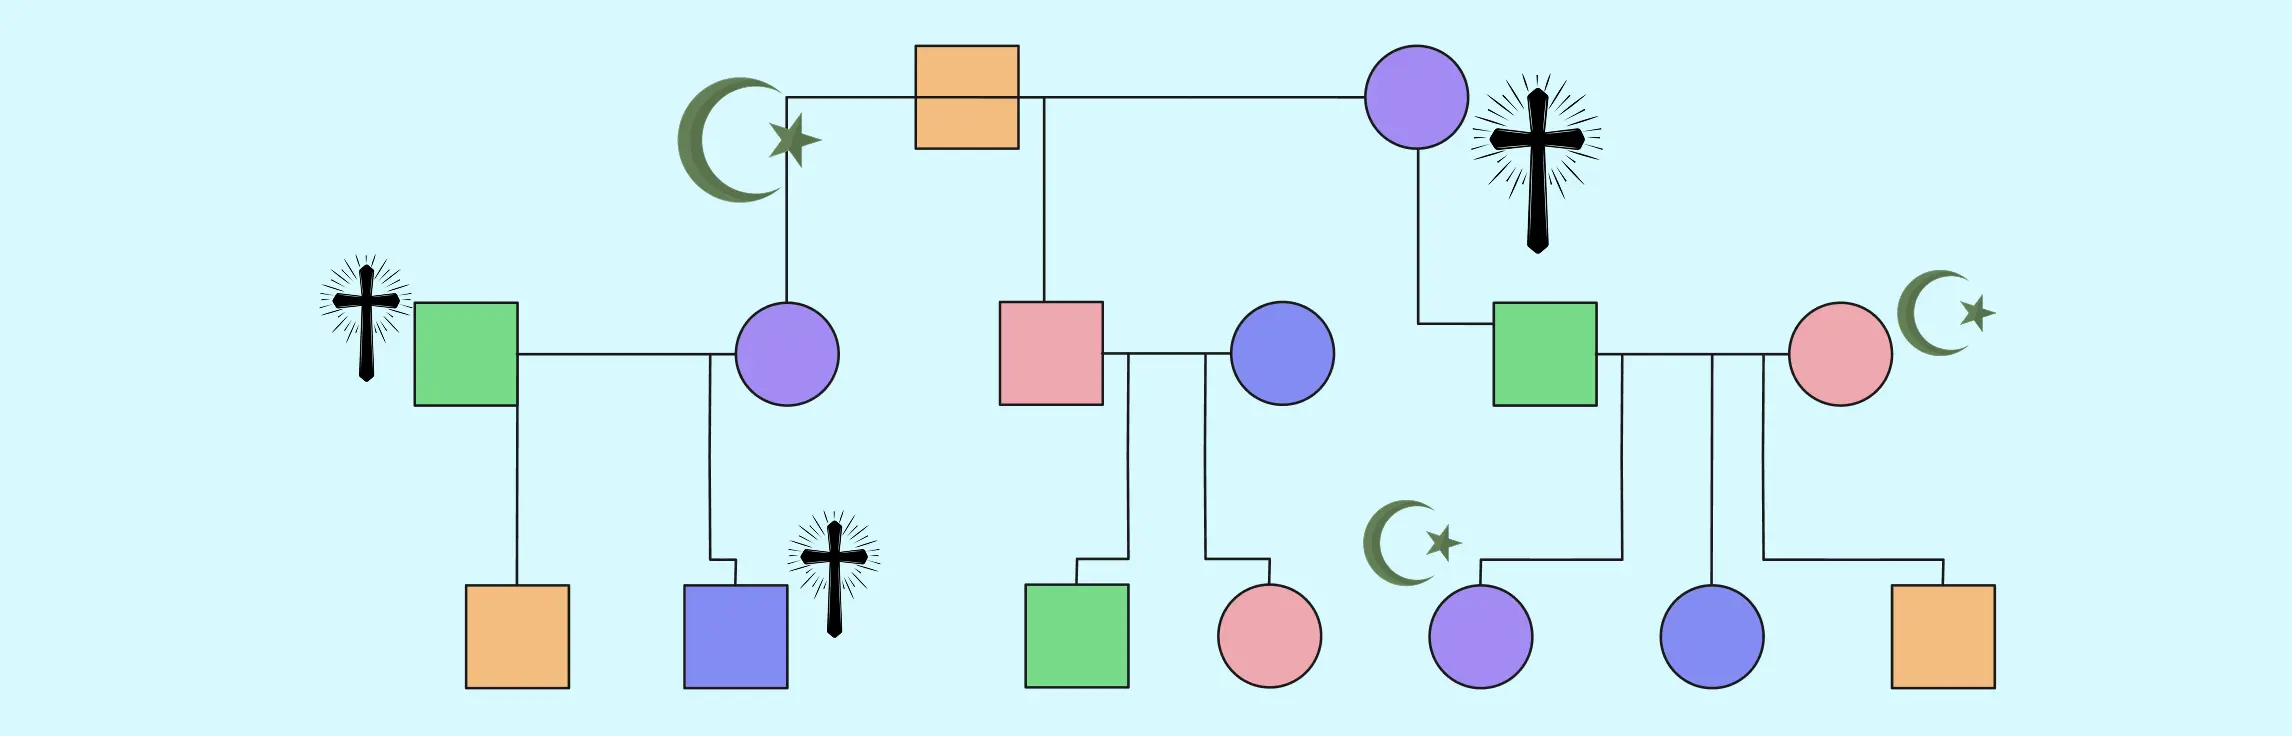
A cultural genogram helps therapists-in-training see how culture, migration, religion, language, and family history shape both clinical understanding and self-awareness. In practical training settings, it is often used to support reflection, supervision, classroom discussion, and intake practice. This guide explains what a cultural genogram shows, what the main symbols represent, and 10 useful ways educators and trainees can apply it.
In this guide, we’ll walk you through what a sociogram is, the key parts that make it work, how to create one, and when and why to use it. Whether you’re a teacher, team leader, counselor, or researcher, sociograms can help you better understand group dynamics and build stronger, more supportive environments.
Understanding culture is essential in social work, as families come from diverse backgrounds, each with unique values, beliefs, and experiences. The culturagram is a visual tool designed to help social workers gain deeper insight into how culture shapes a family’s life and decisions. This guide covers what the culturagram is, when and how to use it, its key components, and how it compares to tools like genograms and ecomaps
This guide compares the best genogram software for 2026, including AI genogram makers, clinical tools, genealogy platforms, and general diagramming apps. You’ll see what each tool is best for, where it falls short, and which option fits your needs—whether you’re creating genograms for therapy, social work, healthcare, research, education, or family history.
Genograms go beyond family trees by mapping relationships, health patterns, life events, and emotional connections across generations. To make them clear and meaningful, it’s important to follow standard genogram rules for symbols, lines, layout, and documentation.
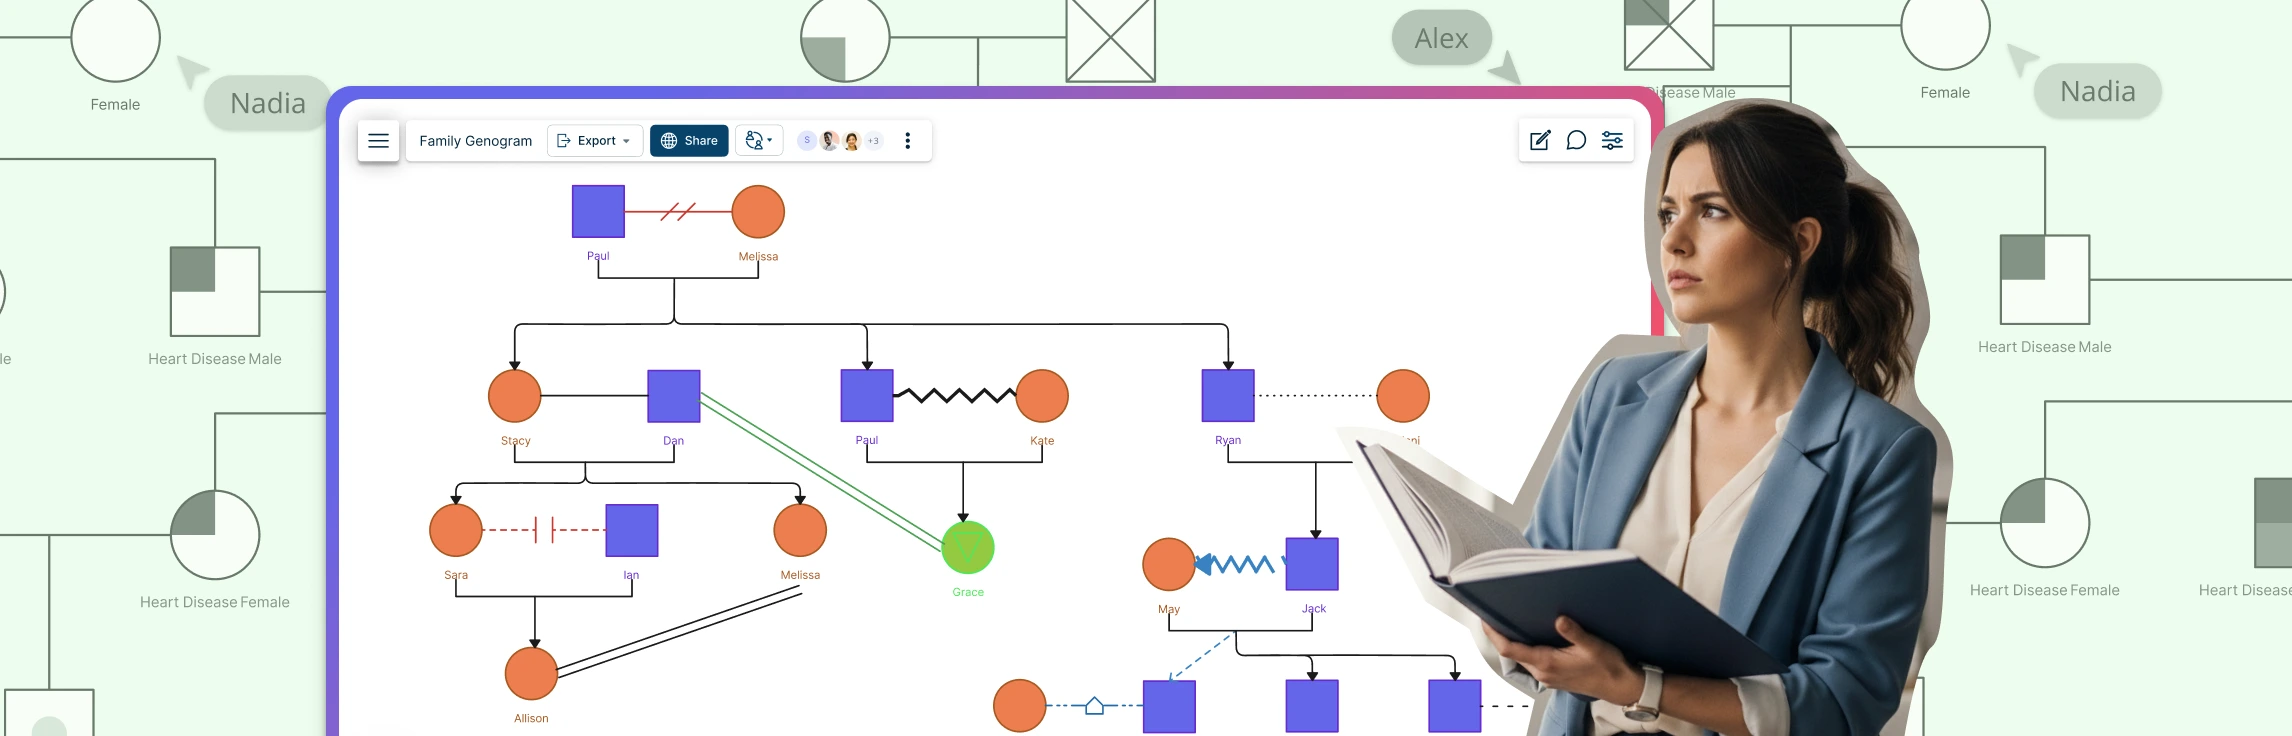
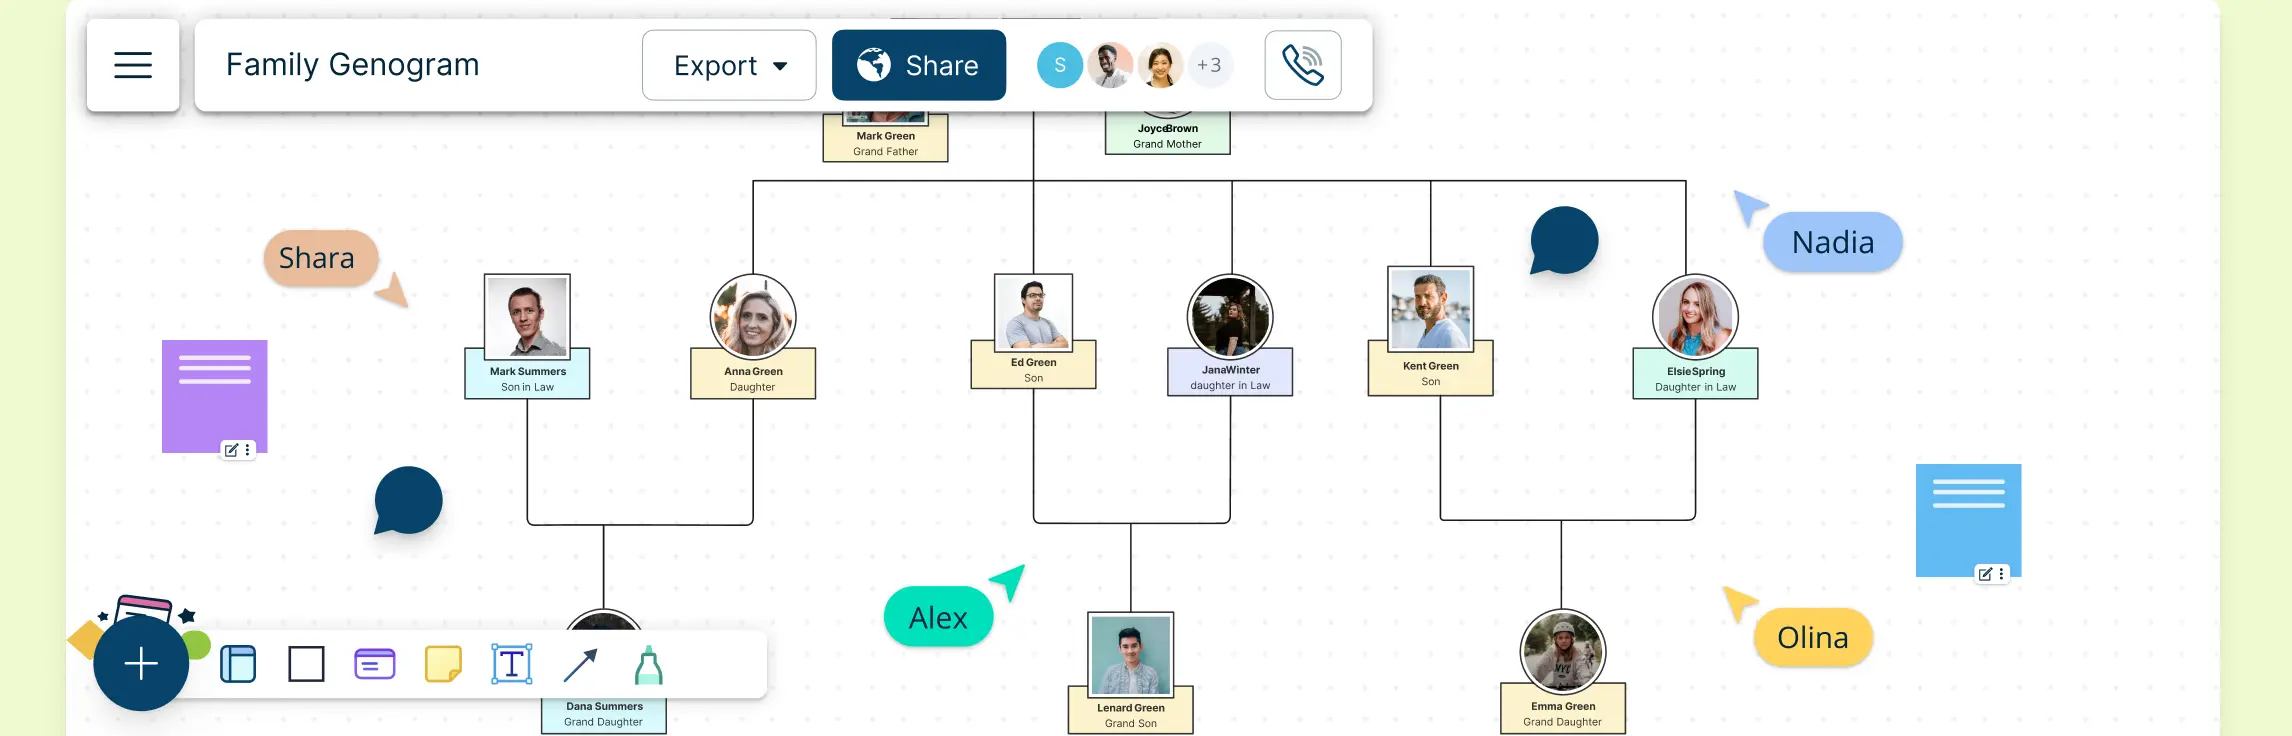
A family genogram goes beyond a traditional family tree by visually mapping relationships, health patterns, and emotional dynamics across generations. This guide explains what a family genogram is, how to create one step by step, and its practical uses in therapy, education, and healthcare. It also highlights the key benefits of building a genogram and introduces Creately as a simple, effective platform for designing your own.
A genogram in psychology is more than a family tree—it’s a visual tool for therapists, counselors, and mental health professionals to explore emotional patterns and relationships. This guide explains how to create a genogram psychology step-by-step, its benefits in therapy, and why Creately is ideal for accurate professional psychology genograms with free real world examples.
A simple genogram is a powerful visual tool used to map out family relationships, behaviors, and patterns over multiple generations. Unlike a basic family tree, a genogram offers deeper insights into the dynamics of family connections—including emotional ties, medical histories, and even career paths. Whether you’re a counselor, healthcare professional, or simply seeking to understand your family’s history, creating a simple genogram can help uncover important patterns and connections that influence behavior and decision-making.
A genogram is a detailed visual diagram that maps out family relationships, traits, and patterns across multiple generations. Unlike a basic family tree, it goes deeper by capturing emotional connections, medical histories, behavioral patterns, and significant life events. Using standardized symbols—such as squares for males, circles for females, and various lines to show relationships—a genogram typically includes at least three generations and provides insights into how family members relate to each other emotionally, psychologically, and genetically. It is used by therapists to explore family dynamics, by medical professionals to identify hereditary health risks, and by individuals or families to understand their roots and uncover recurring patterns. Most professional genograms include three generations because that range is usually enough to reveal repeating patterns while still keeping the diagram practical to interpret. Ultimately, a genogram serves as a powerful tool for self-awareness, healing, and preserving family history.
If you want to make a genogram on a Mac, you do not need to install a separate desktop app. Creately works in your browser, so you can start from Safari, Chrome, or another modern browser and build your genogram in an online workspace.
If you want to make a genogram on Google Docs, you can do it with the built-in Drawing tool, basic shapes, text boxes, and connectors. This method works best for simple family diagrams or quick drafts, but it takes more manual effort as the genogram becomes more detailed.
If you ever wondered how money habits and financial stress passes through generations, this comprehensive financial genogram (also called money genogram) guide is for you. It shows you how to create a financial genogram with helpful examples, templates, and tips. Perfect for estate planning, working with advisor or simply understand your financial root.
What Is a Career Genogram A career genogram is a visual tool that maps your family’s jobs and educational backgrounds across generations. It is a type of genogram that helps you spot patterns—like recurring professions or shifts in career paths—that may influence your own choices. By understanding these trends, you can make more informed decisions and gain clarity on how your family’s experiences shape your career path.
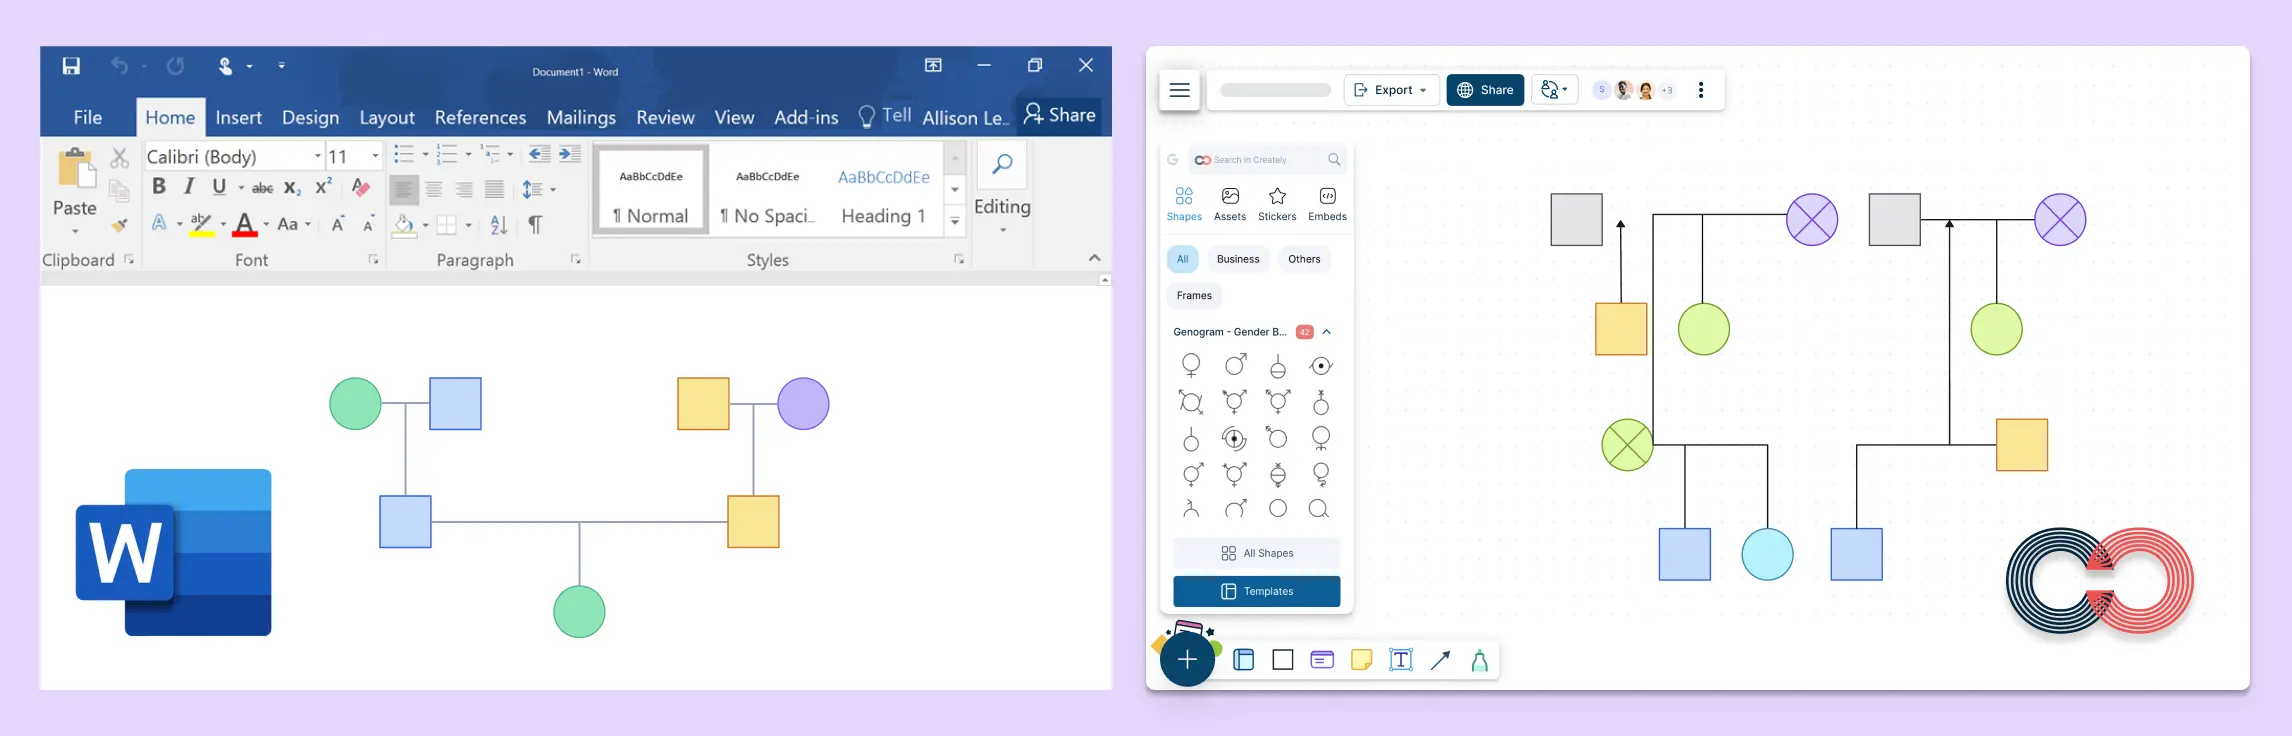
You can create a genogram in Microsoft Word by adding shapes for family members, labeling them, and manually drawing relationship lines. That works for simple family maps, but it gets slow once you need standardized symbols, multi-generation edits, or detailed emotional and medical relationships. This guide shows the basic Word workflow, its main limitations, and when a dedicated genogram tool is easier to manage.
If you’ve tried building a genogram in PowerPoint, you’ve probably run into the same friction points: manually duplicating shapes, aligning connection lines, and trying to represent complex family dynamics with tools that weren’t built for genograms. That’s where Creately offers a major advantage. Instead of treating a genogram like a slide drawing, it gives you purpose-built genogram tools such as clinically meaningful relationship types, AI-assisted generation, structured family data fields, and export options that work better for documentation, collaboration, and presentations.
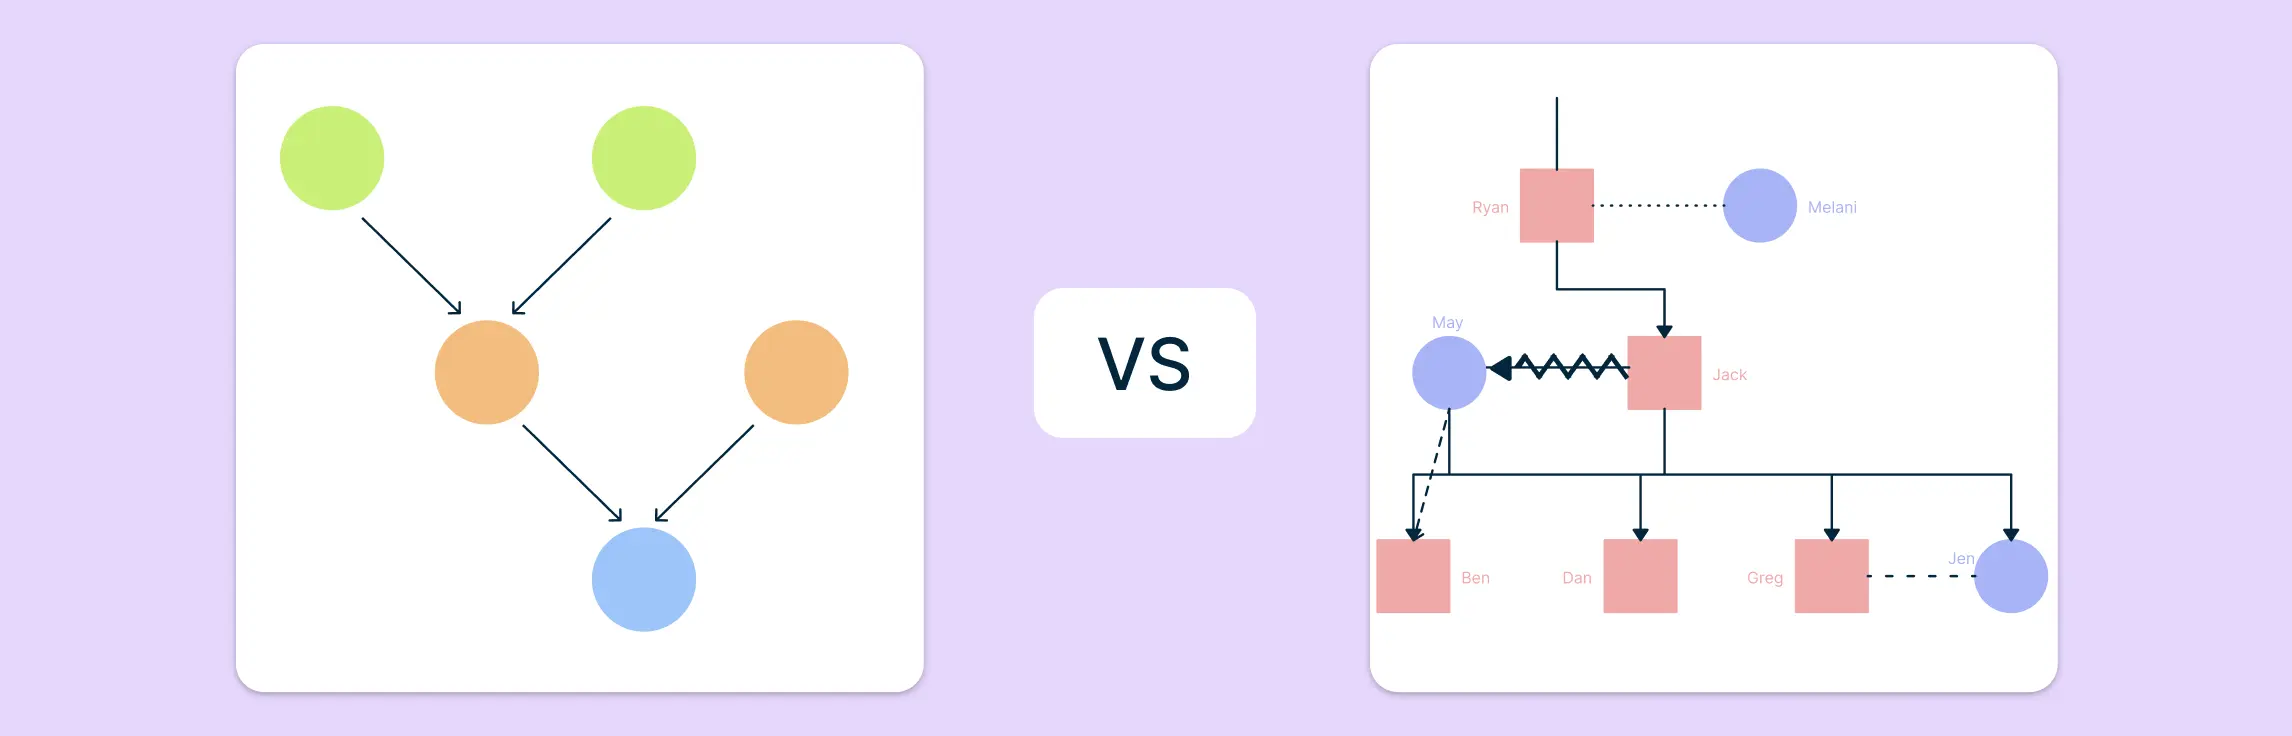
Understanding your family’s history involves more than just names and dates, it’s about uncovering the stories and connections that define your lineage. This guide explains the differences between genograms and family tree diagrams, their importance, and how Creately can help you create them.
What Are Spiritual Genograms? spiritual genograms are a visual representation of an individual’s or family’s spiritual and religious history across multiple generations. It maps out significant spiritual events, denominational affiliations, religious beliefs, practices, and spiritual orientations within a family. Much like a family genogram, which focuses on family relationships, a spiritual genogram emphasizes the spiritual connections and influences that shape a person’s worldview and spiritual identity.
Genograms are a powerful tool in therapy, helping clients visualize family relationships, patterns, and histories. By asking the right genogram questions for therapy, therapists can uncover deeper insights into family dynamics, emotional connections, and recurring challenges.
A creative genogram is a dynamic and visually engaging way to map family histories, emotional relationships, and generational patterns. Unlike traditional genograms, which focus primarily on lineage and medical history, creative genograms incorporate colors, symbols, and other elements to provide a deeper understanding of family dynamics and emotional connections.
In this guide, we’ll explore different types of genograms that you can create using Creately. The main types include: Family Genogram
Genograms in therapy help clinicians connect present-day symptoms, relationship struggles, and coping patterns to the wider family system. Instead of treating each issue in isolation, a therapy genogram gives counselors, psychologists, and clinical social workers a way to map structure, emotional ties, major life events, and recurring themes in one view.
A genogram is a visual representation of family relationships and dynamics, often used to analyze hereditary patterns, psychological traits, and character development. In fiction, genograms help writers, researchers, and fans understand the complex relationships within stories, revealing generational conflicts, inherited traits, and hidden connections that shape a character’s journey.
This guide explores different types of 6-member family tree templates, helping you visualize family relationships across generations and blended family structures. Whether you’re mapping parents, children, grandparents, or extended family members, these templates offer a structured way to preserve and share your family history. Plus, learn how Creately makes building and customizing your family tree simple and collaborative.
A four members family tree is one of the simplest ways to visualize close family relationships, making it ideal for school projects, genealogy, and personal family records. This guide showcases visual four members family tree examples using ready‑to‑use, customizable templates you can adapt in minutes. Explore simple, illustrated, vertical, and circular family tree designs to compare layouts and choose what works best for your needs. Each example can be easily edited, personalized, and shared online, helping you create a clear and meaningful family tree without starting from scratch.
Creating a five person family tree can be confusing, especially when you’re trying to fit parents, children, or extended relatives into a clear and accurate layout for a school project, genealogy research, or personal records. This guide brings together easy‑to‑use five members family tree templates with real examples to help you choose the right structure, and avoid common mistakes when using it. You will also learn how to customize a family tree with 5 members quickly using Creately’s editable diagrams.
Have you ever wondered why some kids inherit their mother’s curly hair while others take after their father’s straight hair? The answer lies in genetics—the science of how traits are passed down from parents to their children.
Understanding relationships, whether within a family or between an individual and their social environment, is key to gaining valuable insights. This is where tools like genograms and ecomaps come in.
How to Make a Pedigree Chart Learning how to make a pedigree chart starts with understanding family relationships, standardized symbols, and inheritance patterns rather than simply drawing a diagram. Pedigree charts are widely used in genetics, healthcare, and education to show how traits and conditions move through generations.
Ever feel overwhelmed trying to connect the dots between different species? Whether you’re a student or a researcher, data can feel like a scattered puzzle until you find the right lens. Enter the cladogram: the ultimate visual roadmap for the history of life. Far from a simple chart, it’s a high-level blueprint that transforms complex data into a clear story of ancestry. This guide explores what a cladogram is, how its anatomy works, and why this visual logic is the secret to understanding evolutionary biology.
Understanding the intricate web of evolutionary relationships among various species can be challenging. A phylogenetic tree serves as a crucial tool in this pursuit, offering a visual representation of evolutionary descent from common ancestors. These diagrams are a fundamental element in the study of biology and evolution, providing a structured way to organize and interpret biological diversity and lineage.
In the study of biological diversity and evolution, diagrams play an essential role in visualizing relationships among various species. Two primary types of diagrams used for this purpose are cladograms and phylogenetic trees. While they may appear similar, understanding their distinctions is crucial for accurate interpretation.
If you have ever stared at a cladogram and felt like you were trying to solve a puzzle without the instructions, you are not alone. It’s a common frustration: you see a series of lines and species, but find yourself asking, “Is a bird more closely related to a crocodile or a lizard?”
A conceptual framework in research is not just a tool but a vital roadmap that guides the entire research process. It integrates various theories, assumptions, and beliefs to provide a structured approach to research. By defining a conceptual framework, researchers can focus their inquiries and clarify their hypotheses, leading to more effective and meaningful research outcomes.
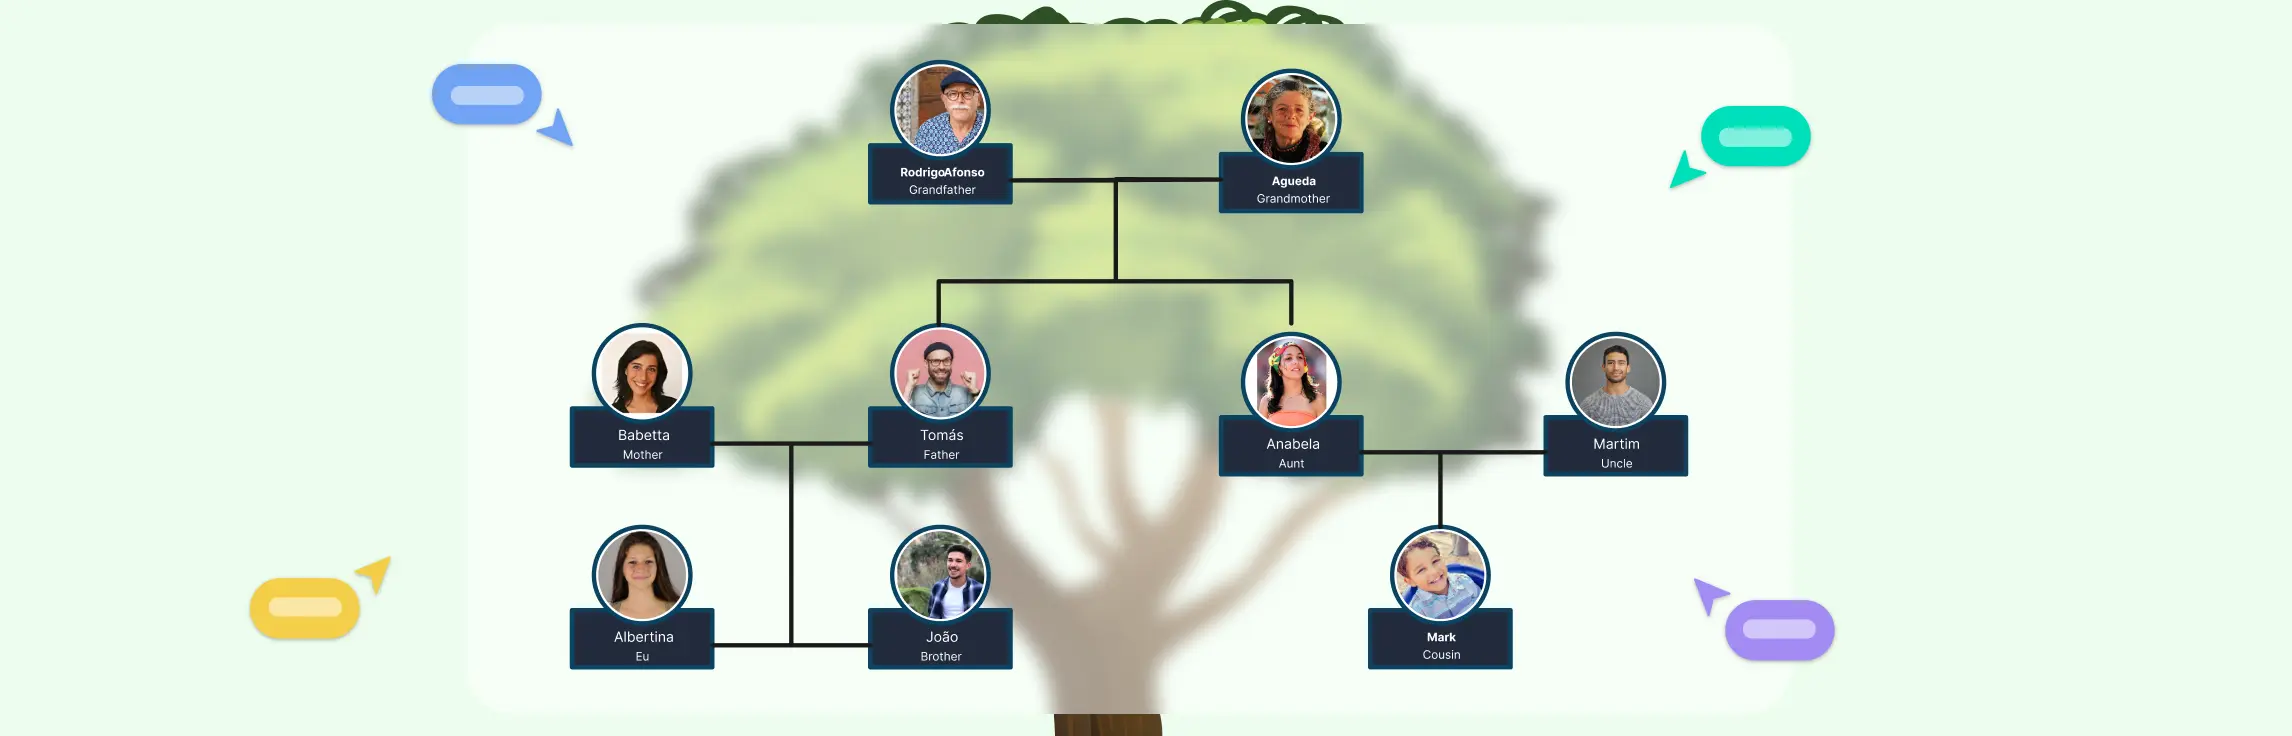
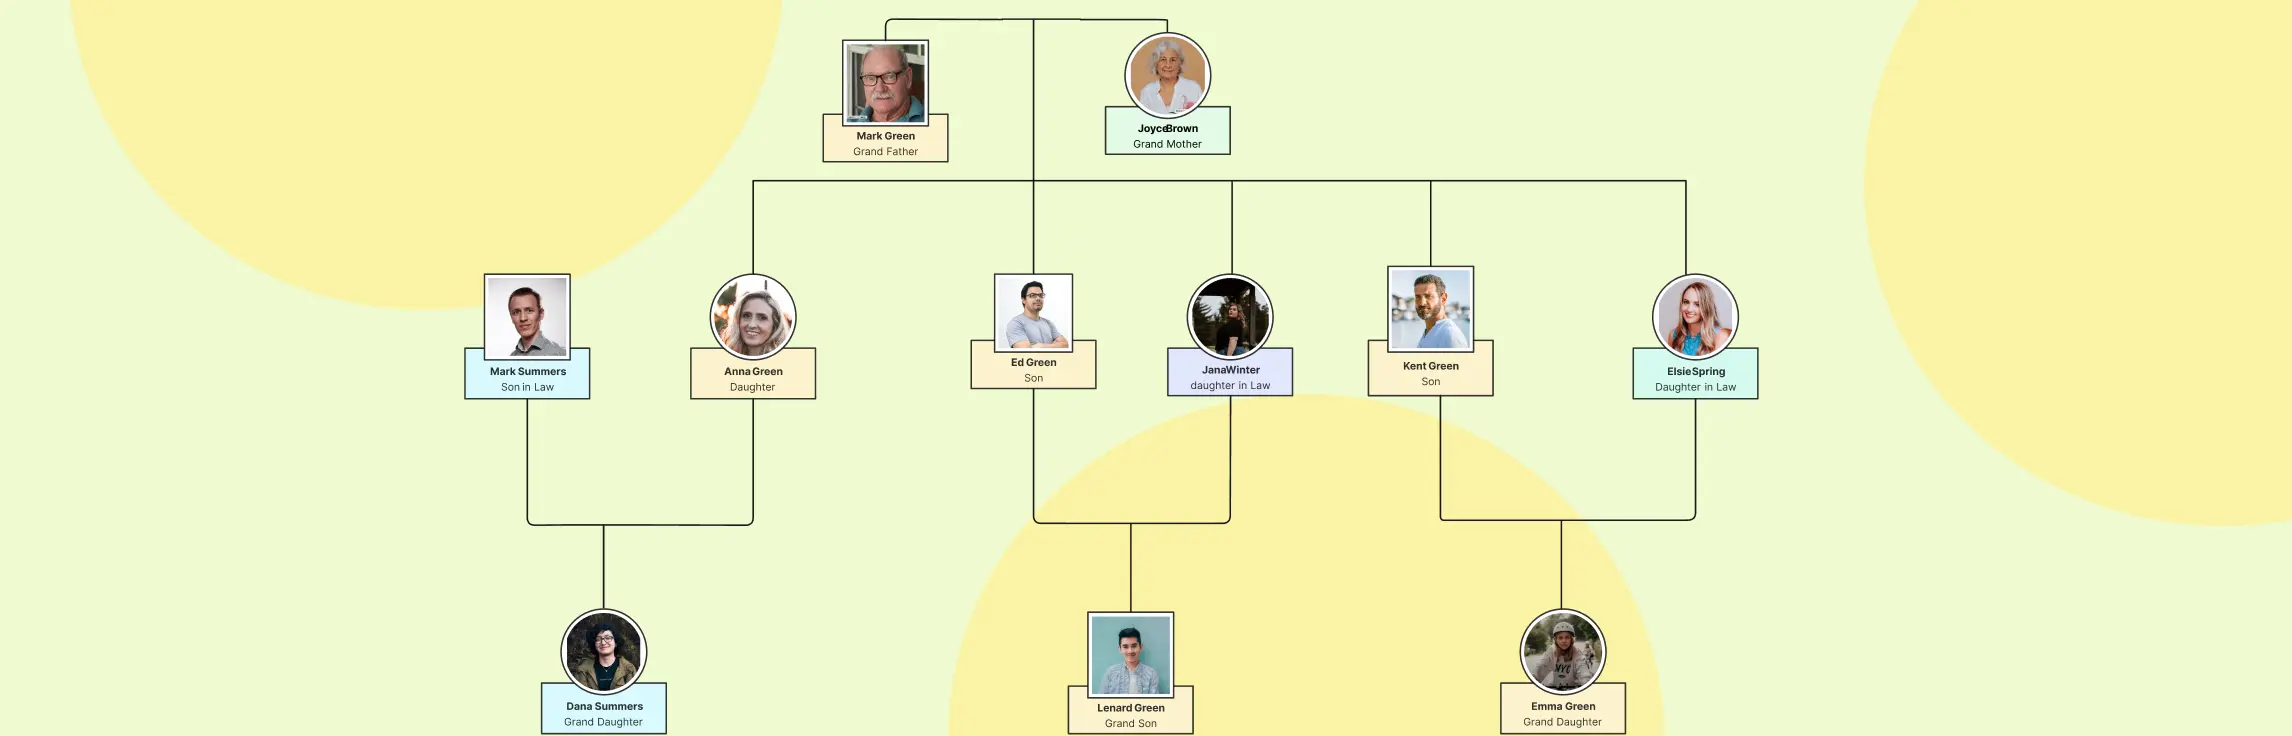
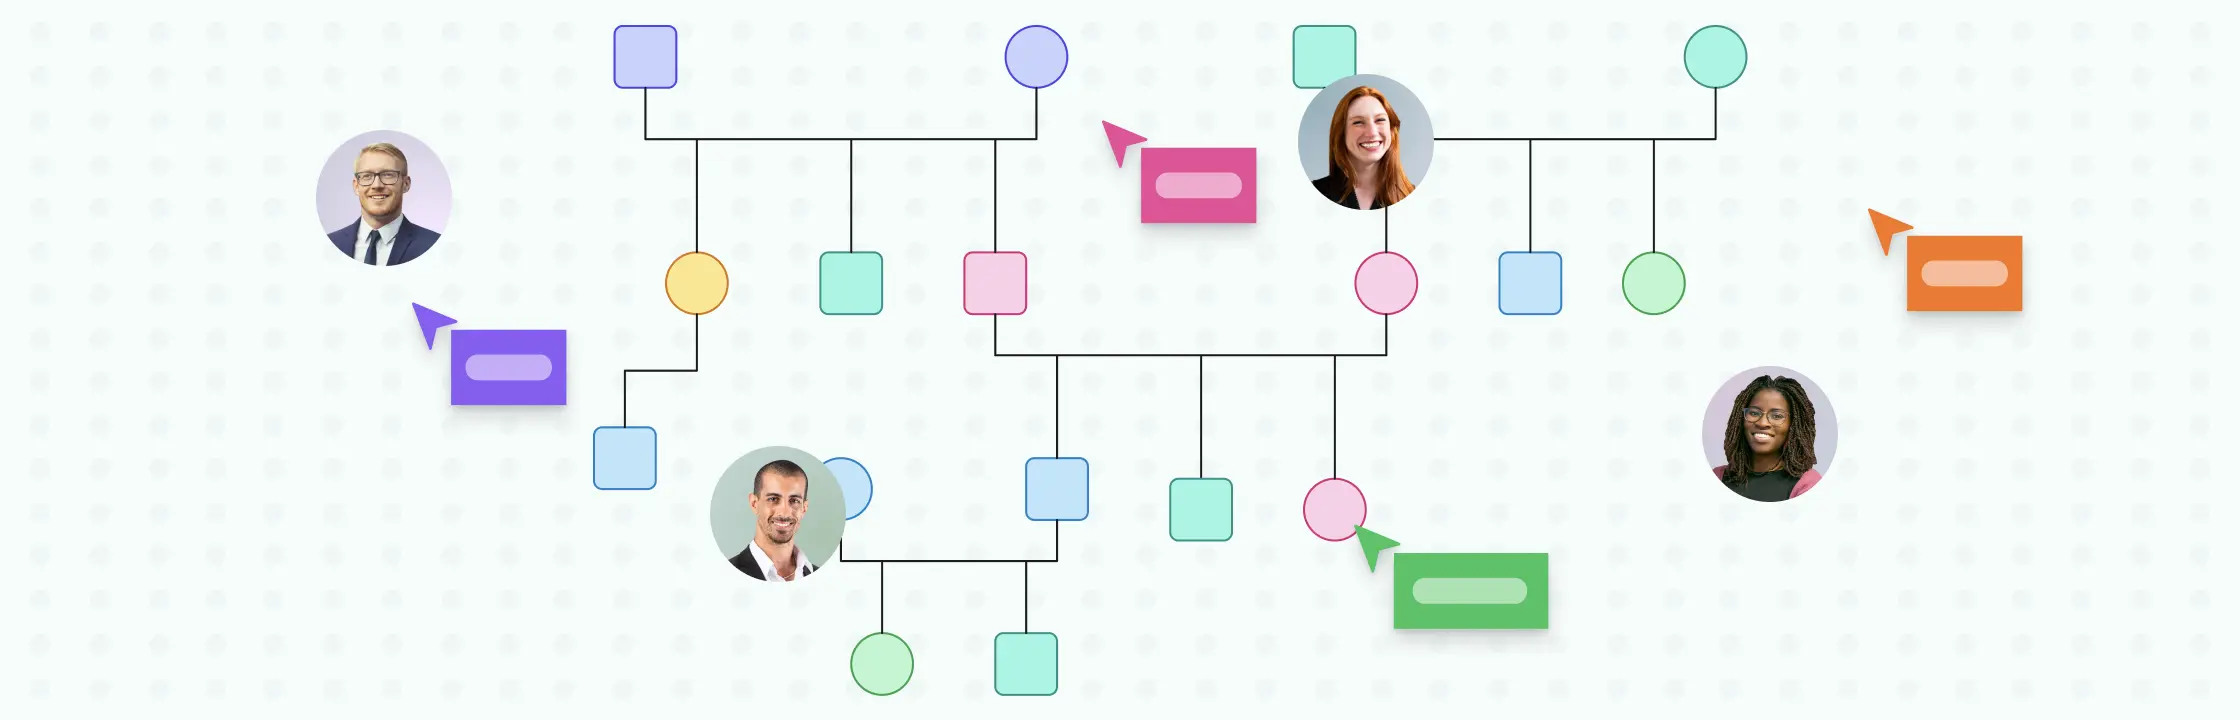
A family tree is one of the easiest ways to see how people in your family are connected across generations. Whether you’re making one for a school project, personal research, a family event, or just to preserve family history, the key is to keep it clear, organized, and easy to update.
What Is a Kinship Diagram? Kinship diagrams help people visualize how family members are connected across generations. They are useful when you need something more structured than a simple family tree, whether you are documenting lineage, studying social relationships, or mapping hereditary patterns for research and healthcare.
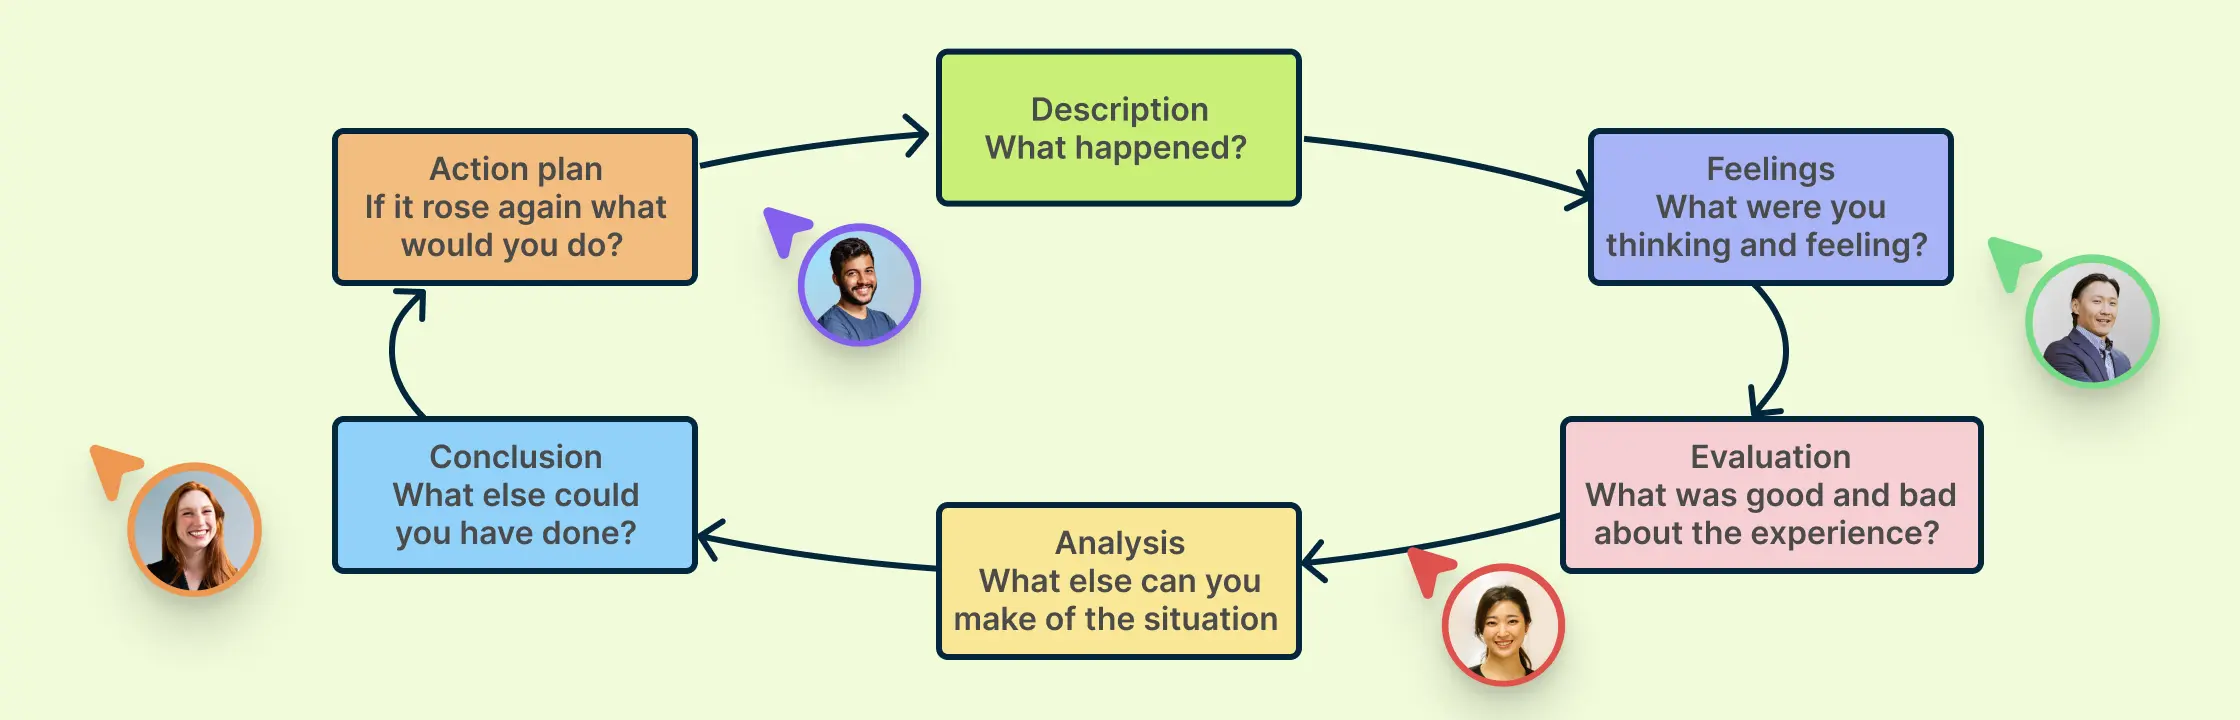
Reflective practice involves engaging in a thoughtful examination of your actions, feelings, and responses to experiences. This process enhances self-awareness and promotes continuous personal and professional growth. Reflective practice encourages critical thinking, improving decision-making and problem-solving abilities. Here’s a comprehensive guide to the Gibbs reflective cycle and how you can use it for personal and professional reflection and development.
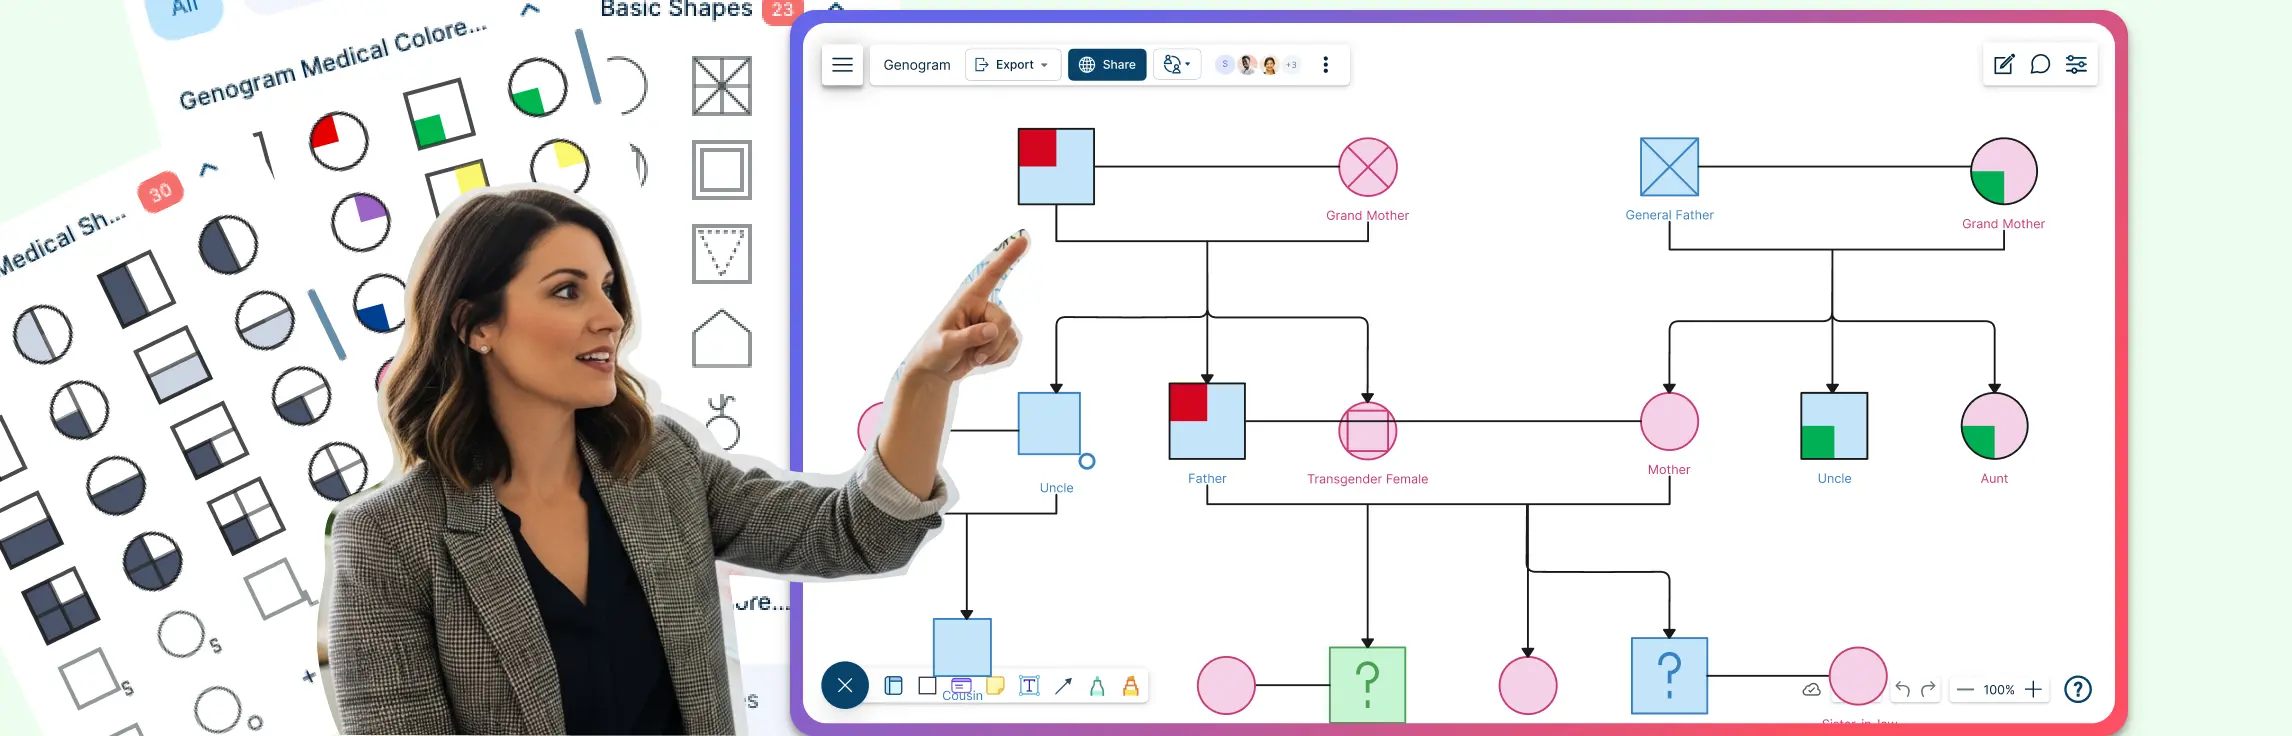
Medical genograms are visual tools that map a family’s health history across generations, helping identify inherited conditions and patterns. By using accurate medical genogram symbols, these diagrams go beyond traditional family trees to reveal genetic, emotional, and psychological health links. Whether you’re building a health history genogram or exploring medical genogram examples, they are essential for preventive care, genetic counseling, and understanding long-term health risks. Medical genograms are commonly used in healthcare, counseling, and genetic research to support early diagnosis, personalized treatment, and preventive care strategies.
A preparatory interview to draw a genogram helps gather detailed family information about the individual or family members being interviewed. It builds a comprehensive picture of the family system, which in turn supports making an accurate genogram.
Whether you are a mental health professional seeking to enhance your therapeutic approach or an individual eager to gain a deeper understanding of your family roots, this post will help you with a comprehensive collection of genogram questions.
Discover how using a genogram in counseling helps therapists identify family patterns and emotional dynamics. This powerful tool supports deeper insights and more effective outcomes in client counseling sessions.
Learning how to make a genogram is easier when you break the process into a few practical steps. You start by deciding which family members and generations to include, then add the right symbols, connect relationships, and label the details that matter for your goal.